.png?fit=max&auto=format&n=BTEMalYyM0xskXeS&q=85&s=3495b9a1f1230446e6de7883f20fc8cd)
Visuals
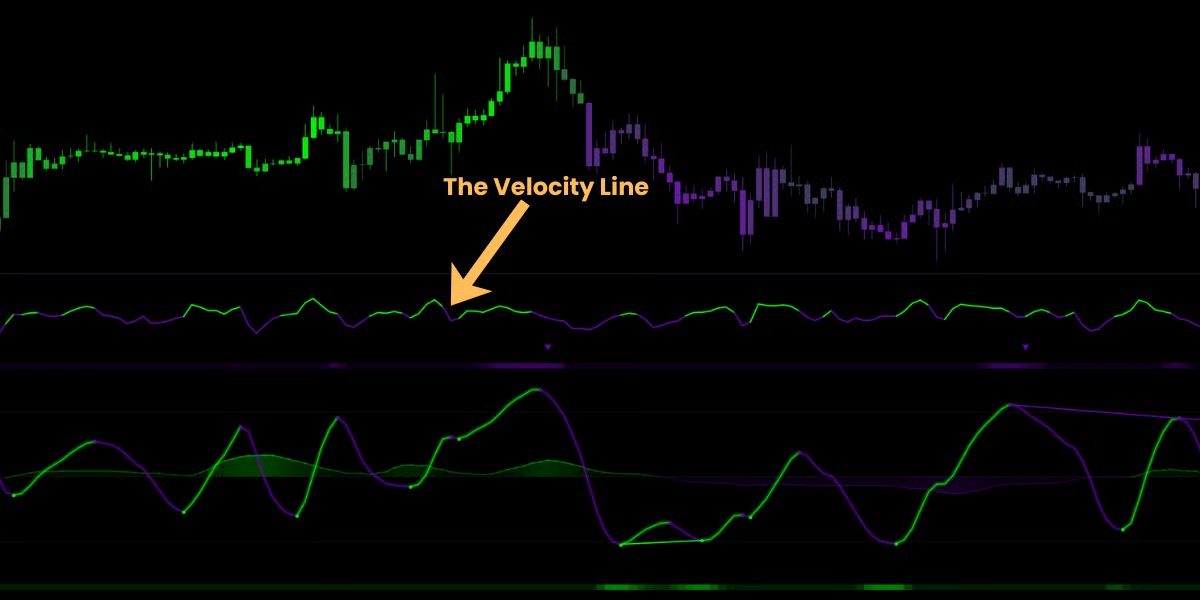
The Velocity Line is distinct from the rest of the tool. It does not oscillate around zero; it is pegged to the top of the panel.- Green Line: Positive Acceleration. Price is speeding up to the upside.
- Red/Purple Line: Negative Acceleration. Price is speeding up to the downside.
The “Hook” (Immediate Exhaustion)
The most valuable signal this line provides is the Velocity Hook. Price often continues to drift higher even after the buying energy has vanished (due to inertia). The Velocity Line cuts through this illusion. It detects the exact moment the “sprint” stops, often giving you a warning signal 1-3 bars before the actual reversal candle forms.The Bearish Hook (Top Calling)
- The Scenario: Price is shooting up aggressively. The Velocity Line is Bullish color
- The Signal: The Velocity Line abruptly curves (hooks) downwards.
- The Meaning: Immediate Exhaustion. The buyers have gasped for air. Even if the current candle is still Green, the upward acceleration has broken. Expect a potential downward move or short pullback.
The Bullish Hook (Bottom Catching)
- The Scenario: Price is crashing down. The Velocity Line is Bearish color.
- The Signal: The Velocity Line abruptly curves (hooks) upwards.
- The Meaning: Seller Exhaustion. The crash has hit a wall. The downward acceleration has stopped, signaling that a bounce or reversal could be coming.
Important: The Velocity Line is designed as a high-sensitivity Early Warning Tool. It is not a standalone Buy or Sell signal.While it excels at spotting immediate exhaustion, price can sometimes pause (hook) and then continue the trend if new volume enters. Never trade a hook blindly. Always use these signals in confluence with other structural confirmations (such as a bounce off a Support level or a crossover on the Core Oscillator) to ensure a high-probability setup.