.png?fit=max&auto=format&n=BTEMalYyM0xskXeS&q=85&s=3495b9a1f1230446e6de7883f20fc8cd)
How to Read the Matrix
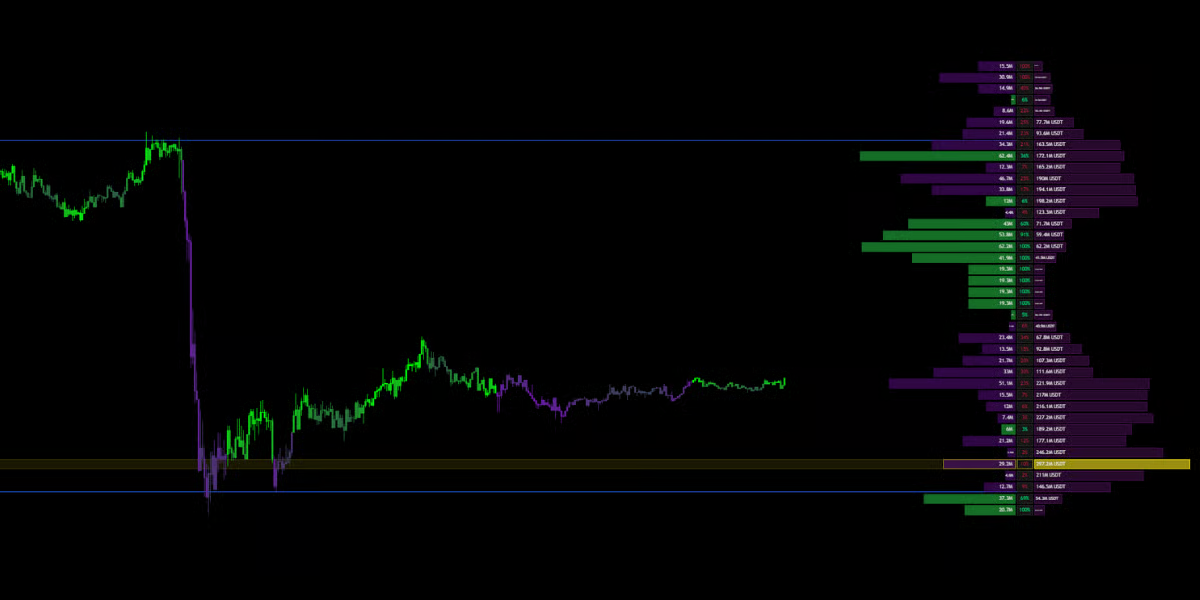
The Matrix is divided into horizontal rows. Each row represents a specific price level.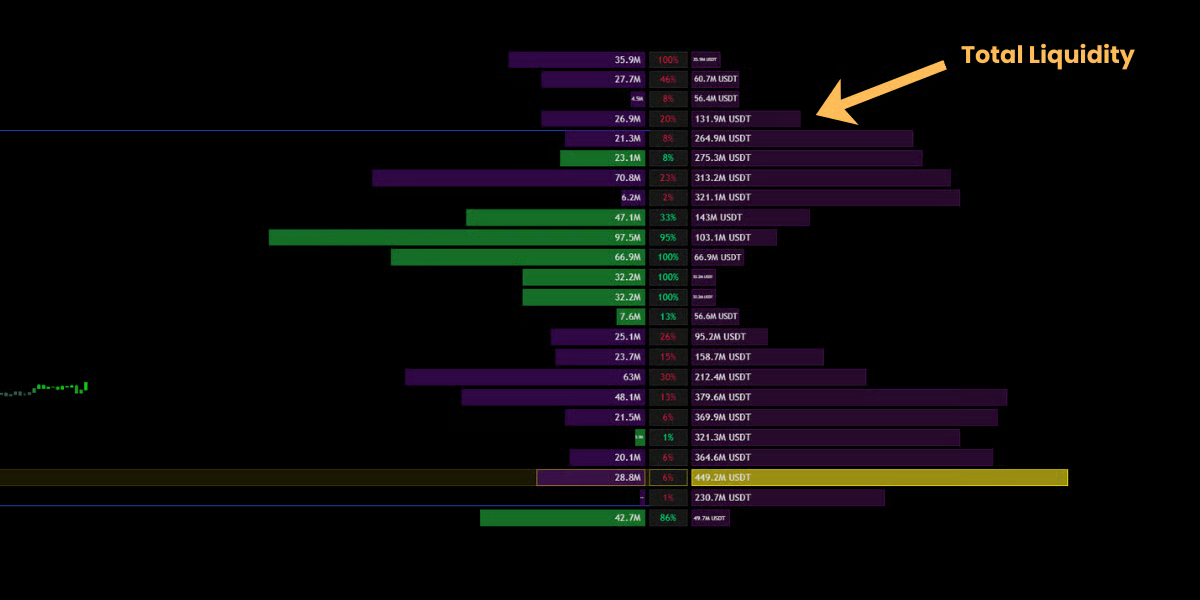
🔹 The Right Wing (Total Liquidity)
- What it shows: Total Volume (History).
- Visual: The bars extending to the Right.
- Meaning: This represents the total amount of shares, coins or contracts traded at this price.
- Interpretation:
- Long Bars (High Volume Nodes): High liquidity zones. Price likes to hang out here (Acceptance).
- Short Bars (Low Volume Nodes): Low liquidity zones. Price tends to speed through these areas (Rejection).\
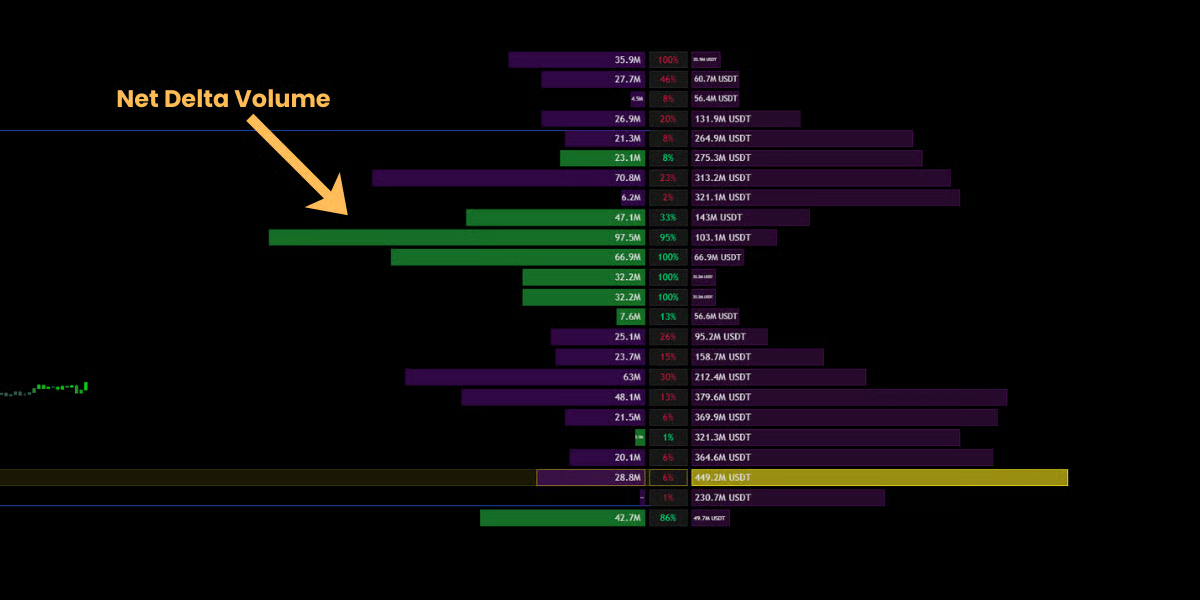
🔹 The Left Wing (Net Delta)
- What it shows: Aggression (The Fight).
- Visual: The bars extending to the Left (Green or Purple).
- Meaning: This shows the Net Delta (Buy Volume minus Sell Volume).
- Interpretation:
- Green Bar (Left): Aggressive Buyers controlled this level.
- Purple Bar (Left): Aggressive Sellers controlled this level.
- Strategy: If price is approaching a resistance level, but the Left Wing shows massive Green bars, it suggests a breakout is imminent (Absorption).
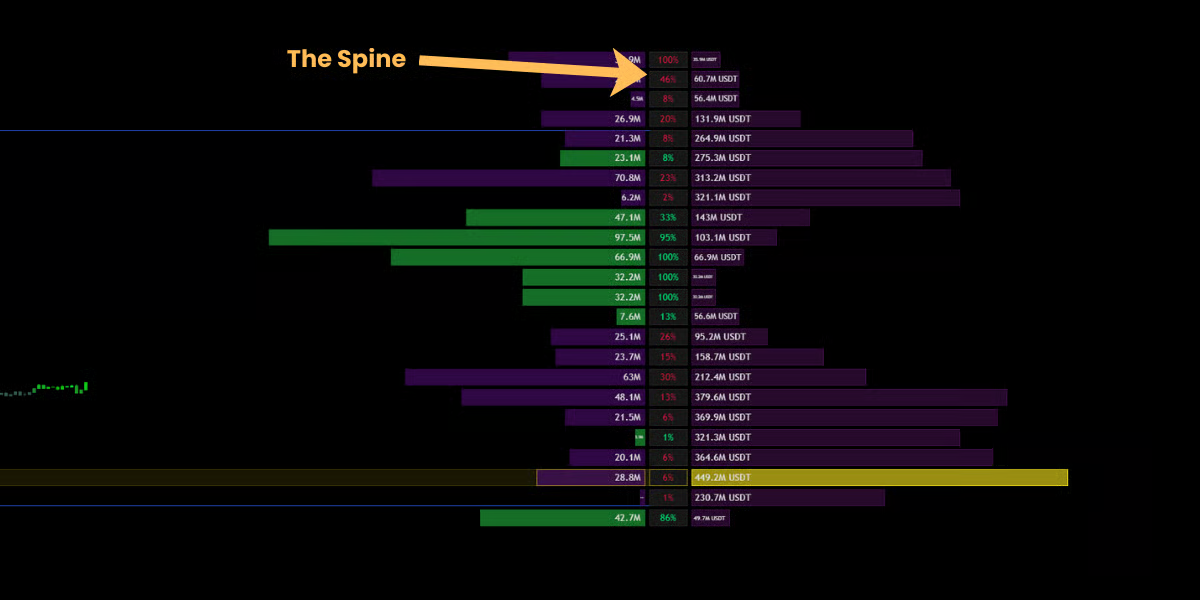
🔹 The Spine (Conviction %)
- Visual: The central column of numbers between the wings.
- Meaning: This displays the Conviction Ratio—the percentage of total volume that was “one-sided.”
- Example: If a level has a 90% spine value, it means it was a pure one-sided domination. If it shows 5%, it was a balanced tug-of-war.
Key Reference Levels
The Matrix automatically highlights the most critical institutional levels.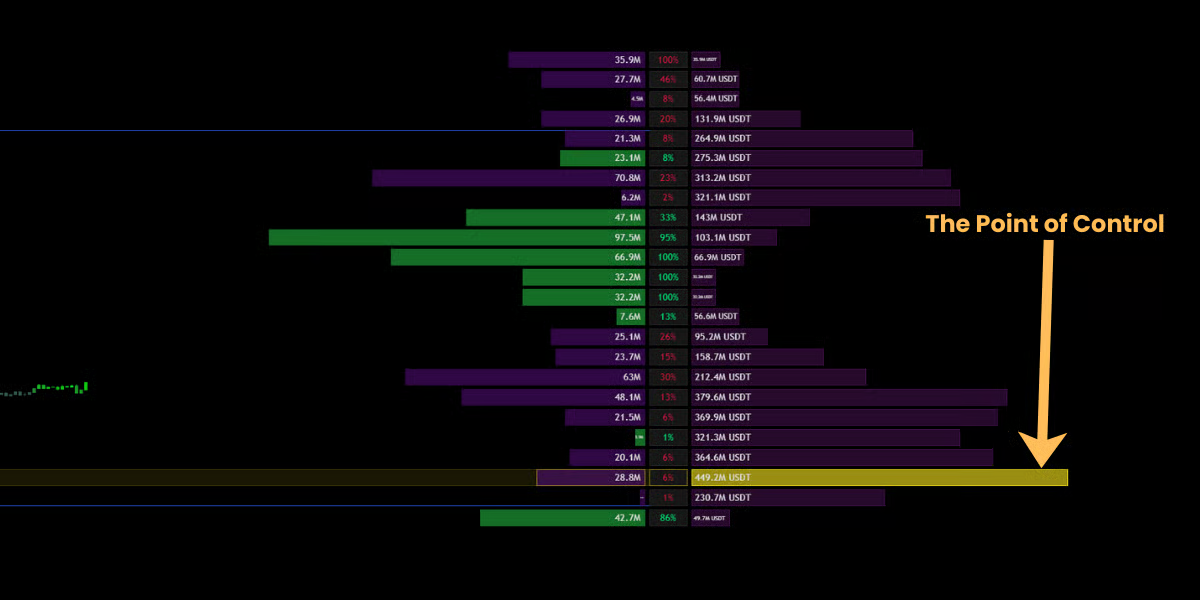
👑 POC (Point of Control)
- Visual: The Gold/Yellow Box.
- Definition: The single price level with the highest volume in the entire range.
- Significance: The POC acts as the strongest “Magnet” on the chart. Price will constantly try to revert to this level.
- Trading: The POC is an excellent Take Profit target.
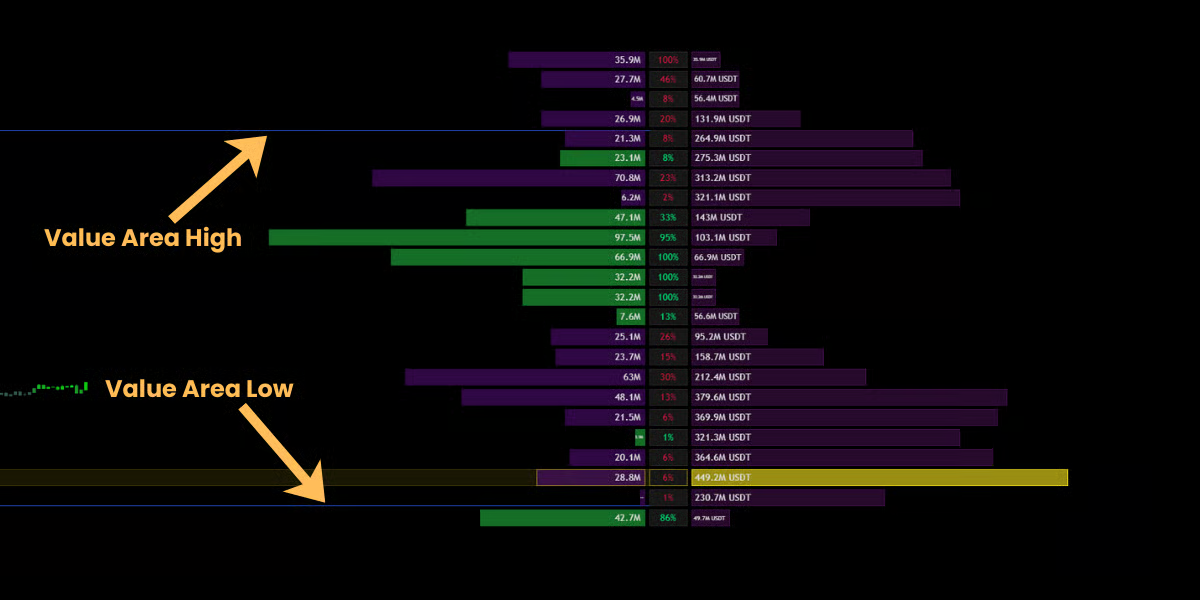
🏛️ Value Area (VAH / VAL)
- Visual: The faint lines bracketing the bulk of the volume.
- Definition: This zone contains 70% of all trading activity (Standard Deviation).
- Significance:
- Inside Value: Price is in “Fair Value.” Expect chop or ranging behavior.
- Outside Value: If price breaks out of the Value Area, it enters “Price Discovery Mode” and trends often accelerate.
Advanced Volume Settings
For institutional-grade analysis, Mkt-Viper Edge gives you granular control over how the Matrix calculates and displays data.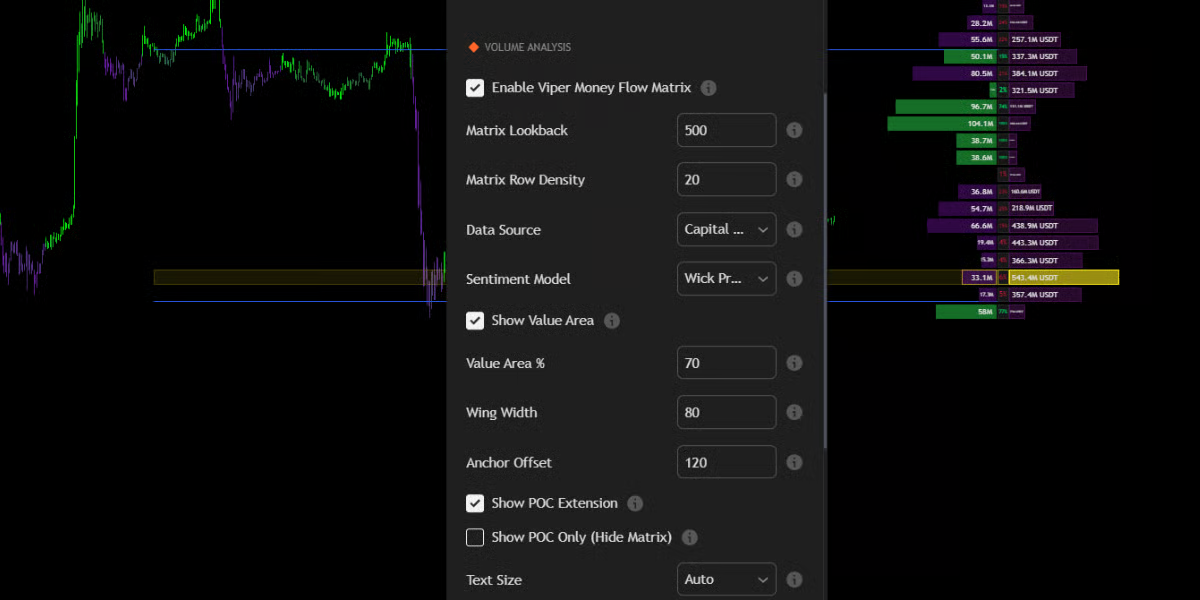
🔹 Sentiment Model (The Logic)
This setting determines how the engine classifies volume as “Bullish” or “Bearish.”- Wick Pressure (Default & Recommended):
- Logic: A proprietary algorithm that analyzes the intra-bar battle. It compares the Upper Wick (selling pressure) to the Lower Wick (buying pressure) relative to the body.
- Why use it: This is far more accurate than standard volume. It can detect “Hidden Buying” inside a Red candle (e.g., a Hammer candle at the bottom of a downtrend).
- Polarity (C > O):
- Logic: Simple calculation. If Close > Open, all volume is counted as Bullish. If Close < Open, all volume is counted as Bearish.
- Why use it: Standard “Up/Down Volume” analysis. Useful if you prefer the classic method used by most stock scanners.
🔹 Matrix Lookback (Time Horizon)
- Setting: Matrix Lookback (Default: 500).
- Definition: This controls the Depth of Vision for the Money Flow Matrix. It determines exactly how many past candles are included in the volume calculation.
- Default (500 bars): Analyzes the last ~500 candles. On a 5m chart, this covers roughly 2 days of price action.
🔹 Matrix Row Density
- Setting: Matrix Row Density (10-100).
- What it does: Controls the vertical resolution of the profile.
- Low Density (10-20): Groups volume into broad blocks. Best for identifying general support/resistance zones on higher timeframes.
- High Density (50-100): Splits volume into fine slivers. Best for “Sniper” entries where you need to see the exact price tick where volume dried up.
🔹 Visual Layout & Anchoring
- Anchor Offset: Adjusts how far the Matrix sits from the current price bar. Increase this value to push the profile to the far right, preventing it from obscuring your recent candlesticks.
- Wing Width: Controls how wide the volume bars extend.
- Text Size: Set to “Auto” by default, but can be forced to Tiny, Small, or Normal depending on your screen resolution (4K vs. Laptop).
🔹 Point of Control (POC) Modes
- Show POC Extension:
- When enabled, it draws a semi-transparent Gold Box extending from the POC to the current price. This visualizes the “Magnet Zone” clearly across the chart.
- Show POC Only (Hide Matrix):
- Minimalist Mode. If you find the full Volume Matrix too distracting, enable this toggle. It will hide all the volume bars and wings, leaving only the critical POC level and Value Area lines visible. This gives you the data without the clutter.
Data Source: Capital Flow vs. Block Volume
Mkt-Viper Edge allows you to choose how volume is calculated in the “Volume Analysis” settings:- Block Volume (Default): Calculates based on raw share/contract count. Best for Crypto and Forex.
- Capital Flow: Weights the volume by price (Volume * Price). This visualizes the actual Dollar Value traded. Best for high-priced stocks (like AMZN or TSLA) or Indices, as it highlights where the “Big Money” actually changed hands, ignoring cheap retail volume.