.png?fit=max&auto=format&n=BTEMalYyM0xskXeS&q=85&s=3495b9a1f1230446e6de7883f20fc8cd)
Volume Validation
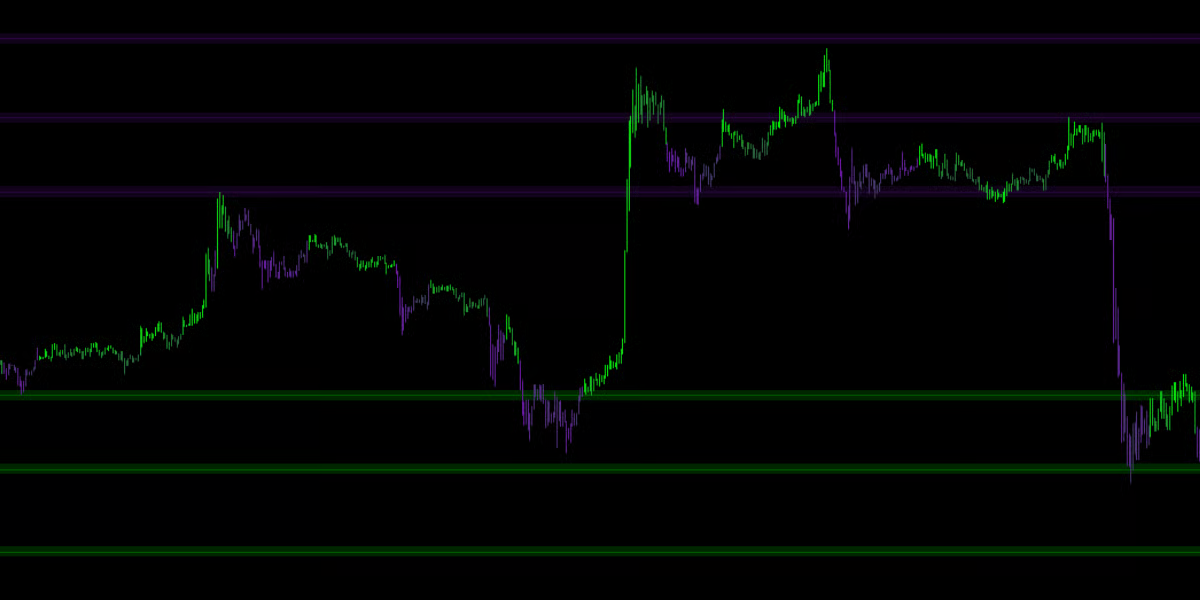
The engine runs a background check on every potential pivot point. This automatically filters out weak, retail-driven turning points. The Smart Grid only plots levels where Institutional Money stepped in to reverse the price.The Holographic View
To keep your chart pristine, Mkt-Viper Edge employs a “Holographic” rendering system.- Infinite Memory: The engine remembers historical levels from hundreds of bars ago (Key Levels).
- Dynamic Focus: Even though it remembers everything, it only displays the lines closest to the current price.
- Auto-Limit: By default, it shows the 6 most relevant Resistance lines above you and the 6 most relevant Support lines below you. As price moves, lines further away fade out, and new relevant lines fade in. This gives you deep historical context without the visual clutter.
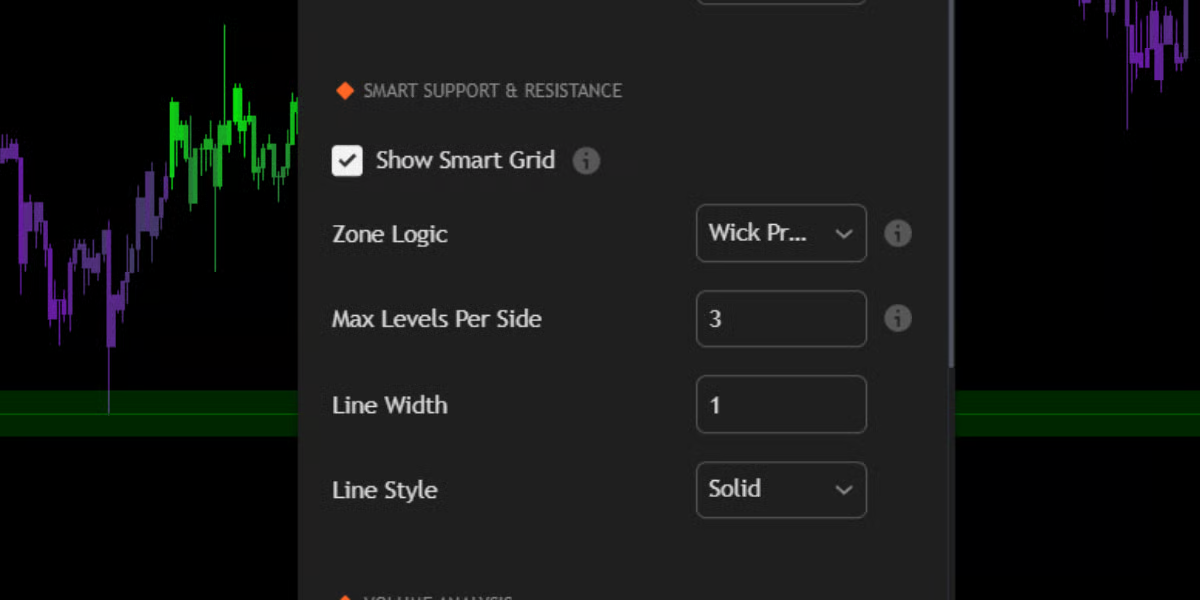
Settings
Zone Logic: Wick vs. Average
Markets rarely turn at a single micro-pip; they turn within “Zones.” You can customize how the Smart Grid handles these zones in the settings:🔹 Wick Precision (Default)
- Behavior: The line snaps to the Absolute High/Low of the wicks in that zone.
- Best For: Sniper entries. This mode assumes that the extreme wick is the point where liquidity was grabbed.
🔹 Average Center
- Behavior: The line floats in the Weighted Center of the cluster.
- Best For: General trend analysis. This shows the “Fair Value” of the zone rather than the extreme edge.
Touch Count & Strength
The Smart Grid learns over time.- Creation: A line is born when a Volume-Validated Pivot occurs.
- Reinforcement: If price returns to that level and bounces again, the engine detects a “Touch.”
- Merging: The engine automatically merges nearby touches into a single, stronger level.
- Key Level Status: If a level survives 5 or more touches, it is flagged internally as a “Key Level” and is prioritized in the display logic.