.png?fit=max&auto=format&n=BTEMalYyM0xskXeS&q=85&s=3495b9a1f1230446e6de7883f20fc8cd)
Overview
Markets do not move in straight lines; they breathe. They expand during news events and contract during lunch hours. Standard Support & Resistance lines often fail because they remain static while the market’s energy changes. Viper Kinetic Ranges (VKR) is a dynamic volatility envelope that adapts to the “Kinetic Energy” of the asset. By calculating the Volume-Weighted Volatility Flux in real-time, the VKR projects the statistical boundaries where price is likely to contain itself or break out.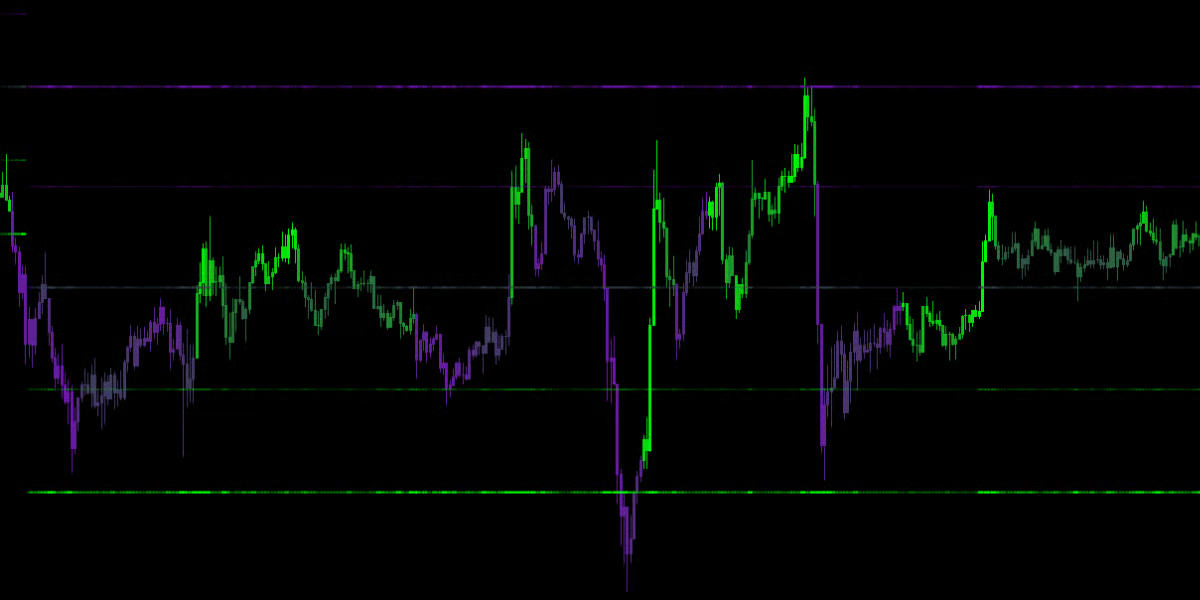
The VKR Levels
When enabled, the VKR plots a set of 5 distinct lines on your chart. These lines act as dynamic reaction zones.🔹 The Equilibrium
- The Center Line.
- This represents the current “Fair Value” or gravitational center of the price action.
- Behavior: In a trending market, this line stair-steps up or down. In a ranging market, price will constantly oscillate around this line.
🔹 Minor Support & Resistance (S1 / R1)
- The Inner Bands.
- These represent the “Normal Noise” of the market.
- Strategy: Price staying inside these bands indicates a low-volatility chop environment. A break outside these bands signals that a move is starting to gain traction.
🔹 Major Support & Resistance (S2 / R2)
- The Outer Bands.
- These represent “Statistical Extremes” or Overextension.
- Strategy: When price hits these outer bands, it has stretched significantly from its equilibrium. This is often a prime location for a Mean Reversion trade (price snapping back to the center) or a profit-taking zone.
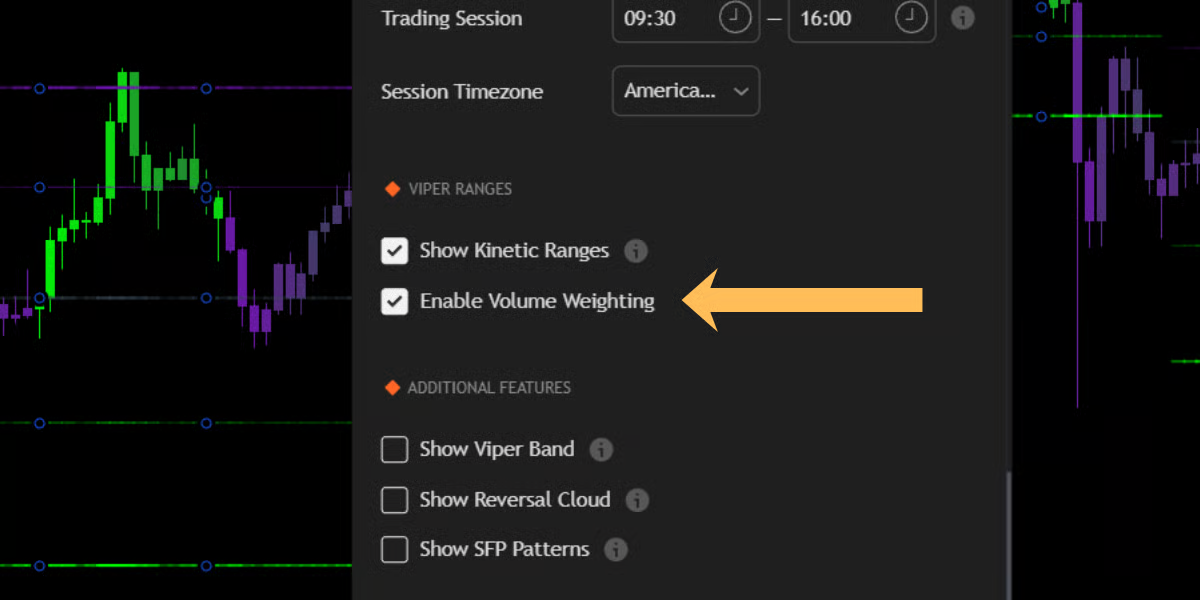
Volume Weighting (Energy)
The “Kinetic” aspect of the VKR engine means it listens to Volume.- Low Volume: The bands contract, acknowledging that price needs less energy to move.
- High Volume: The bands expand, acknowledging that a violent move is occurring and giving the price “room to breathe” without generating false breakout signals.