.png?fit=max&auto=format&n=BTEMalYyM0xskXeS&q=85&s=3495b9a1f1230446e6de7883f20fc8cd)
Visual Components
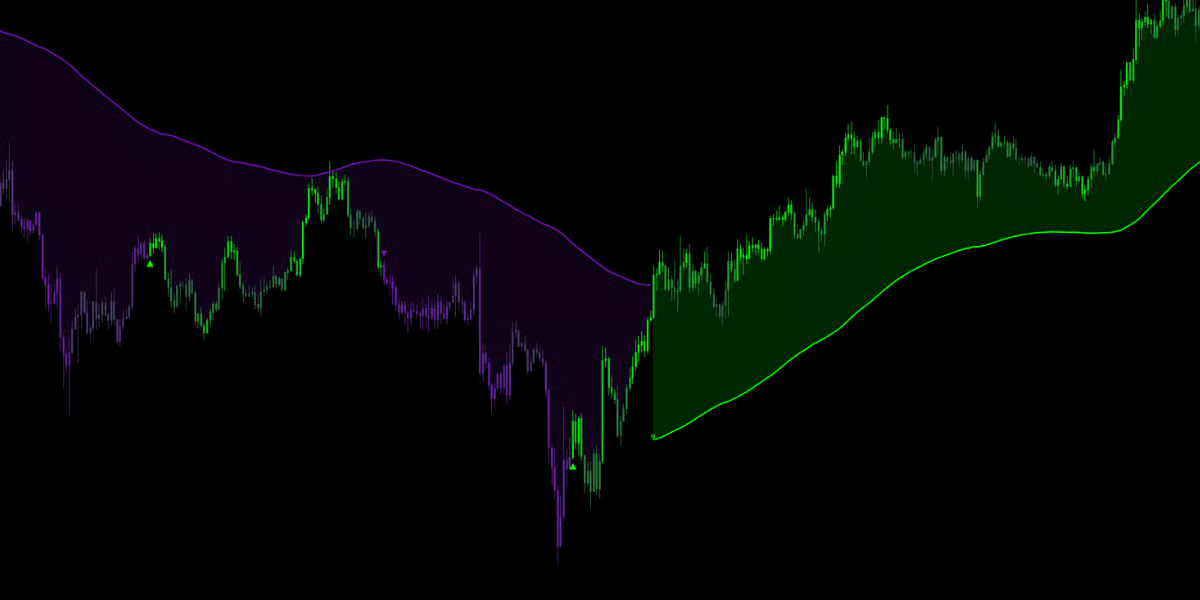
The Navigator works primarily in the background to keep your chart clean, providing context without clutter.The Navigator Cloud
- Bullish Cloud (Green Zone): When the cloud is Bullish Color and below price, the macro-trend is Bullish. This zone acts as dynamic Support. Price pulling back into a Green cloud often presents a “buy the dip” opportunity.
- Bearish Cloud (Purple/Red Zone): When the cloud is Bearish Color and above price, the macro-trend is Bearish. This zone acts as dynamic Resistance. Price rallying into a Red cloud often presents a “sell the rip” opportunity.
The Trend Flip Star (✪)
When the Navigator confirms a major shift in market dominance, it plots a small Star Icon (✪) on the cloud edge.- Star on Bottom: Confirmed shift to a Bullish Macro-Trend.
- Star on Top: Confirmed shift to a Bearish Macro-Trend.
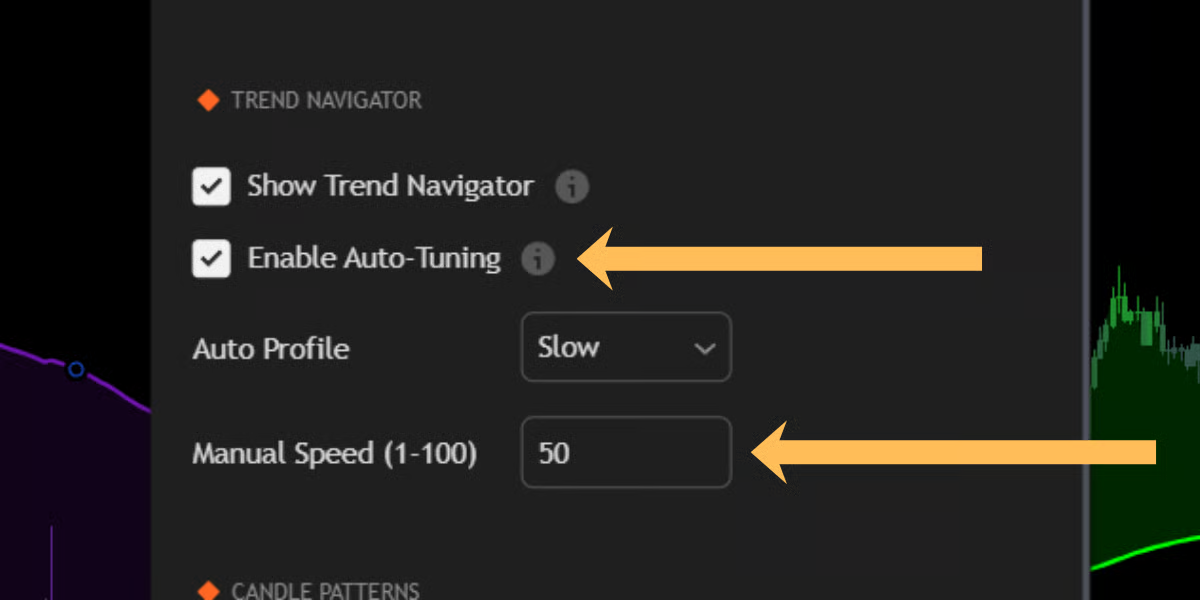
Optimization & Tuning
Just like the main Trend Engine, the Navigator features full customization controls found in the “Trend Navigator” settings group.Auto-Tuning (Recommended)
Enabled by default, this allows the Synapse Engine to automatically calculate the optimal lookback periods based on a selected profile:- Fast: Best for lower timeframes (1m - 15m) where trends shift rapidly.
- Medium: The standard setting for hourly and 4H charts.
- Slow: A heavy filter designed for Daily/Weekly charts or for traders who want to remain in a trend for days at a time.
Manual Speed
For granular control, disable Auto-Tuning and use the Manual Speed (1-100) slider.- Lower Values: Tighter cloud, faster reaction, frequent flips.
- Higher Values: Wider cloud, slower reaction, fewer flips.