.png?fit=max&auto=format&n=BTEMalYyM0xskXeS&q=85&s=3495b9a1f1230446e6de7883f20fc8cd)
Overview
Amateur traders often chase green candles and buy at the very top, just before the market crashes. The Reversal Cloud is designed to prevent this specific error. This tool visualizes the Statistical Extremes of the market. Based on the “Bell Curve” of probability, price spends roughly 95-99% of its time within a standard deviation of its mean. The Reversal Cloud represents that final 1-5% outer zone. Simply put: When price enters the Reversal Cloud, the statistical probability of a reversal or a violent snap-back increases exponentially.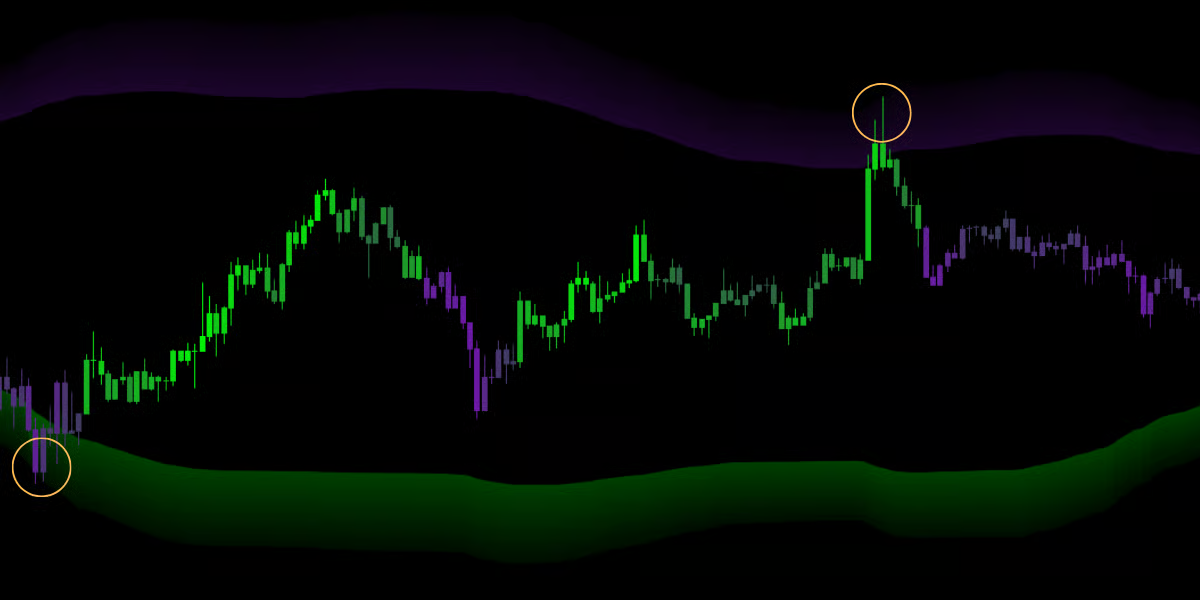
IMPORTANT!Price can stay in the Reversal Cloud during extreme parabolic runs. Always wait for a confirmed rejection candle or a Trend Signal before betting on a reversal. Do not blindly short or long just because price touched the cloud.
The “Event Horizon”
The cloud acts as a warning zone on your chart. It is calculated using a long-term deviation algorithm to filter out short-term noise.- The Upper Cloud (Bearish Zone): When price rallies into this zone, the asset is statistically Overbought. Institutional algos will often begin offloading positions here.
- The Lower Cloud (Bullish Zone): When price dumps into this zone, the asset is statistically Oversold. Smart money often begins accumulating here.
Visual Indicators
- The Cloud Bands: These are the dark, semi-transparent bands at the top and bottom of the screen. They mark the area where the trend is mathematically “Stretched.”
- Magnetic Breach Fill: If price aggressively pushes into the cloud, you will see a bright fill connect the price to the cloud edge. This visualizes the tension. Think of it like stretching a rubber band to its limit—the further it pushes into the fill, the harder it is likely to snap back.