.png?fit=max&auto=format&n=BTEMalYyM0xskXeS&q=85&s=3495b9a1f1230446e6de7883f20fc8cd)
Overview
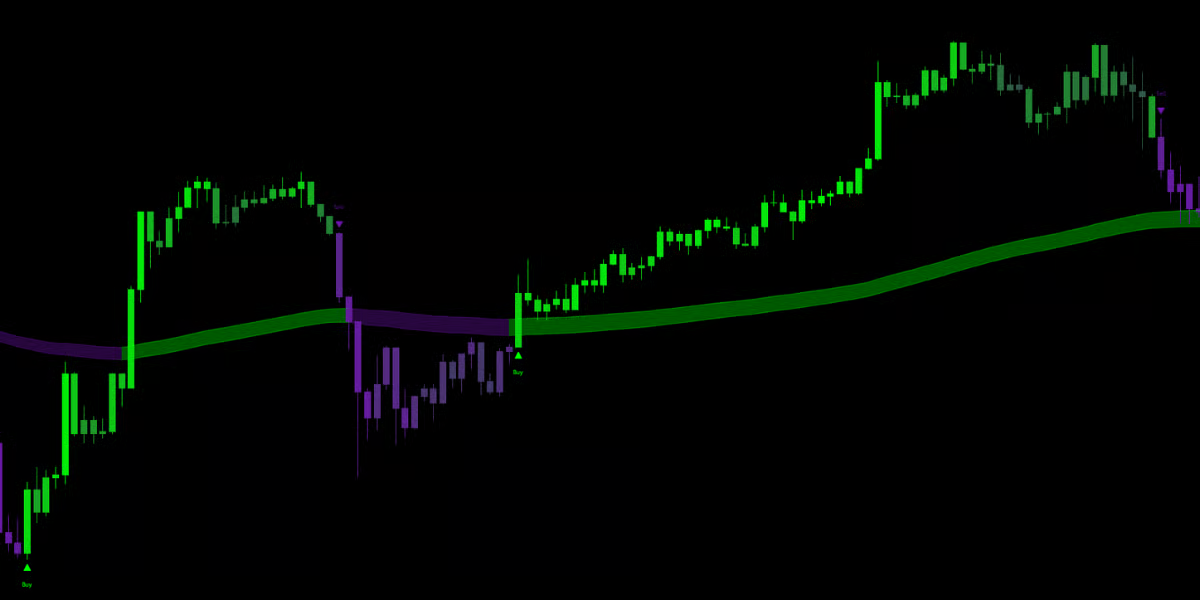
The Viper Trend Engine is the heartbeat of the Mkt-Viper Pro system. Using advanced low lag trend following techniques, the Viper Trend Engine is designed to help you visualize the dominant market trend.Viper Trend Signals & Visuals
The primary output of the engine is the Viper Trend Signal. These appear as triangles on your chart and represent a confirmed “Trend Flip.”- Buy Signal (Green Triangle): Indicates the algorithm has detected a shift to positive momentum. This is a potential long entry or a signal to close short positions.
- Sell Signal (Red Triangle): Indicates the algorithm has detected strong downward momentum. This is a potential short entry or a signal to close long positions.
- **Strong Signal: **Indicates the algorithm has detected a potentially stronger shift in trend momentum.
IMPORTANT NOTE!The Viper Trend Signals are to be used as an additional form of confluence within other layers of your technical analysis. These signals should NOT be bought or sold blindly. While the signals can accurately identify shifts in market momentum, we strongly recommend you use these signals as confirmation alongside other methods to ensure a comprehensive, high-probability trading strategy.
Optimizations
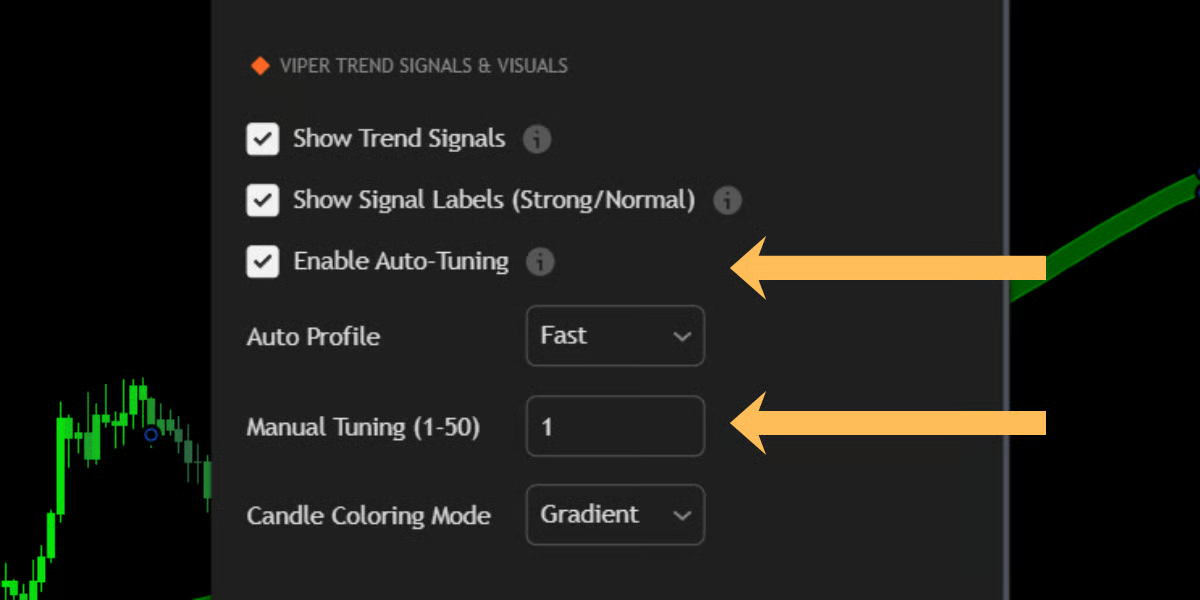
There are two ways to optimize your Viper Trend Signals:1. The Auto-Tuner
When “Enable Auto-Tuning” is checked, the indicator actively analyzes market conditions, volume and volatility to automatically adjust its sensitivity. You simply choose a profile that matches your trading style:- Fast Profile: The most aggressive setting. It hugs price closely and provides earlier entries. Ideal for Scalpers who want to catch shorter market trends.
- Moderate Profile: The balanced setting. It filters out more market noise while still getting you into trends early. Ideal for catching longer term trends.
- Slow Profile: A conservative setting designed to ignore short-term volatility. It aims to capture the “meat” of the move.
2. Manual Optimization
For advanced users who want total control, you can disable the Auto-Tuner and use the Manual Tuning (1-50) slider.- Lower Values (1-20): The trend engine becomes highly sensitive. It will react very quickly to price changes but may produce more false signals in choppy markets.
- Higher Values (20-50): The trend engine becomes smoother and slower. It acts as a heavy filter, requiring significant price movement to flip the trend.
Please note:Auto tuning optimizations automatically adjust to market conditions. This does not mean it will always be perfect. Remember to consider confluence and market sentiment.