.png?fit=max&auto=format&n=BTEMalYyM0xskXeS&q=85&s=3495b9a1f1230446e6de7883f20fc8cd)
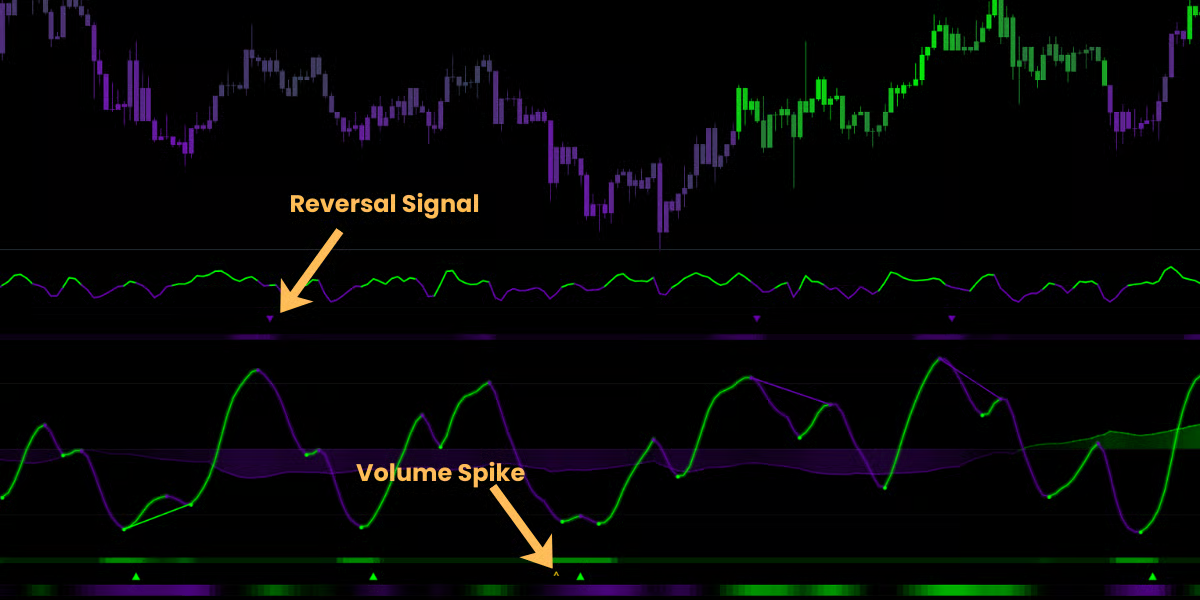
Reversal Signals (Triangles)
You will occasionally see small Triangles (▴/▾) appear above or below the oscillator wave. These are Reversal Signals. They appear when the oscillator has pushed deep into an Extreme Zone (Overbought/Oversold) and momentum begins to weaken.- Green Triangle (▴): Bullish Warning.
- Momentum was deeply Oversold and selling strength begins to fade.
- Meaning: Sellers are exhausting. Be prepared for a potential bounce or trend shift to the upside.
- Red Triangle (▾): Bearish Warning.
- Momentum was deeply Overbought and beginning to weaken.
- Meaning: Buyers are exhausting. Be prepared for a potential pullback or trend shift to the downside.
Note: These triangles indicate that a reversal could be coming soon. They are best used as a “Heads Up” to tighten your stops or look for an entry trigger on the main chart. These are NOT signals to be bought and sold blindly.
Volume Spikes (Gold Arrows)
Distinct from the triangles, you may see Gold/Yellow Arrows (or Carets ⌃ / ⌄) appear. These do not track momentum; they track Panic and Euphoria. These markers trigger only when a massive “Volume Anomaly” is detected (a 3-Sigma Volume Spike at a price extreme).- Gold Up Arrow (⌃): Stopping Volume (Bullish).
- Context: Price is crashing, but suddenly a massive surge of volume enters.
- Psychology: This is “Capitulation.” Retail traders are panic selling, and Institutions are stepping in to absorb the liquidity. The crash is likely over.
- Gold Down Arrow (⌄): Climax Volume (Bearish).
- Context: Price is skyrocketing, but a massive volume spike occurs.
- Psychology: This is “FOMO.” Retail traders are panic buying at the top, and Institutions are selling into the strength. The rally is likely over.