.png?fit=max&auto=format&n=BTEMalYyM0xskXeS&q=85&s=3495b9a1f1230446e6de7883f20fc8cd)
- During Consolidations: The band slows down and flattens to prevent false signals.
- During Breakouts: The band accelerates to hug price tightly, allowing you to ride the trend without getting stopped out prematurely.
Visuals
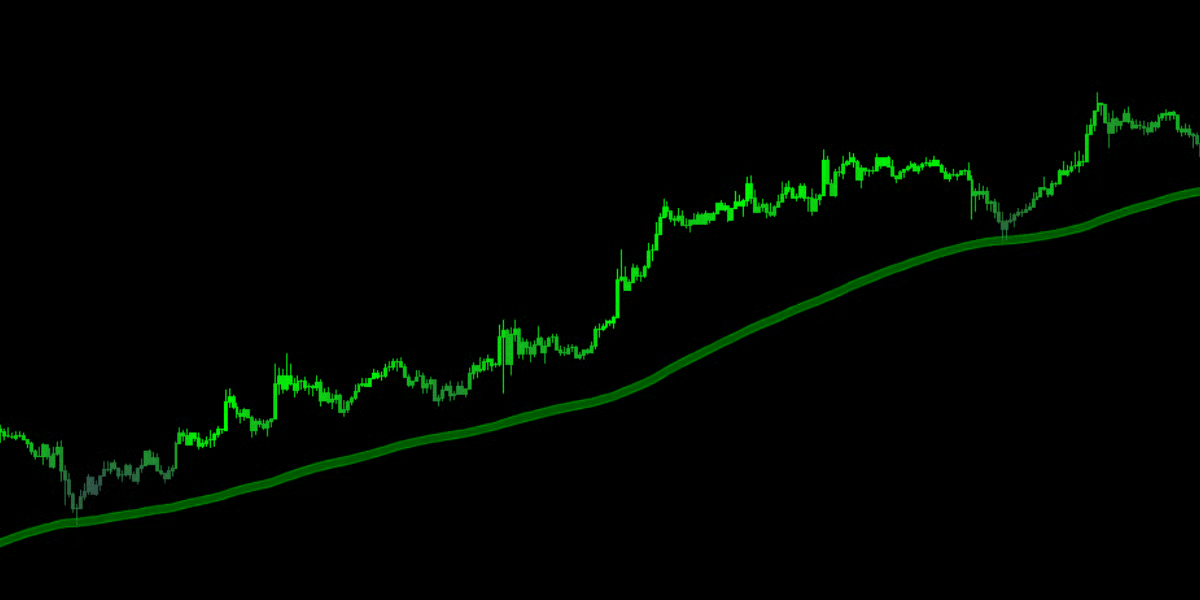
The Viper Band plots as a shaded ribbon running through the price action. Its color tells you the immediate health of the trend.- Green Band: Bullish Control. Price is holding above the trend baseline. This is a “Buy Zone.”
- Red Band: Bearish Control. Price is holding below the trend baseline. This is a “Sell Zone.”
- Grey/Neutral: The band retains its previous color until a definitive break occurs. This helps filter out “whipsaw” movements where price briefly spikes across the line but fails to hold.
The “Magnet” Effect
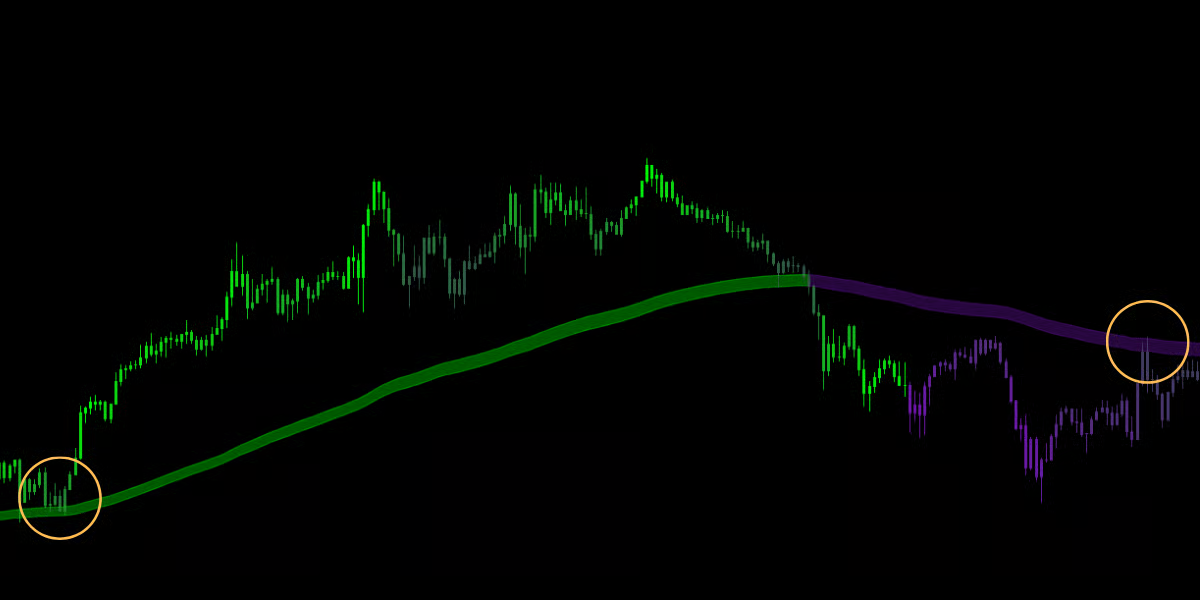
Unlike the Viper Trend Engine (which signals reversals), the Viper Band is best used as a Mean Reversion Tool. Because the band represents the “True Value” of the asset, price has a natural tendency to snap back to it like a rubber band.- The Setup: When price moves significantly far away from the Viper Band (extension), it is statistically likely to pause and retrace back to the band.
- The Trade: You can use the Viper Band as a target for your take-profits, or wait for price to touch the band to enter a trend-continuation trade (e.g., Buying the dip when price touches the Green Band).