.png?fit=max&auto=format&n=BTEMalYyM0xskXeS&q=85&s=3495b9a1f1230446e6de7883f20fc8cd)
IMPORTANT!Do not consider these patterns as buy or sell signals. Consider them as early warning signs showing that a trend could be weakening and opposing bullish or bearish pressure may be stepping into the market. If you see these signals, look for other confirmations of a potential reversal.
Pattern Library & Symbols
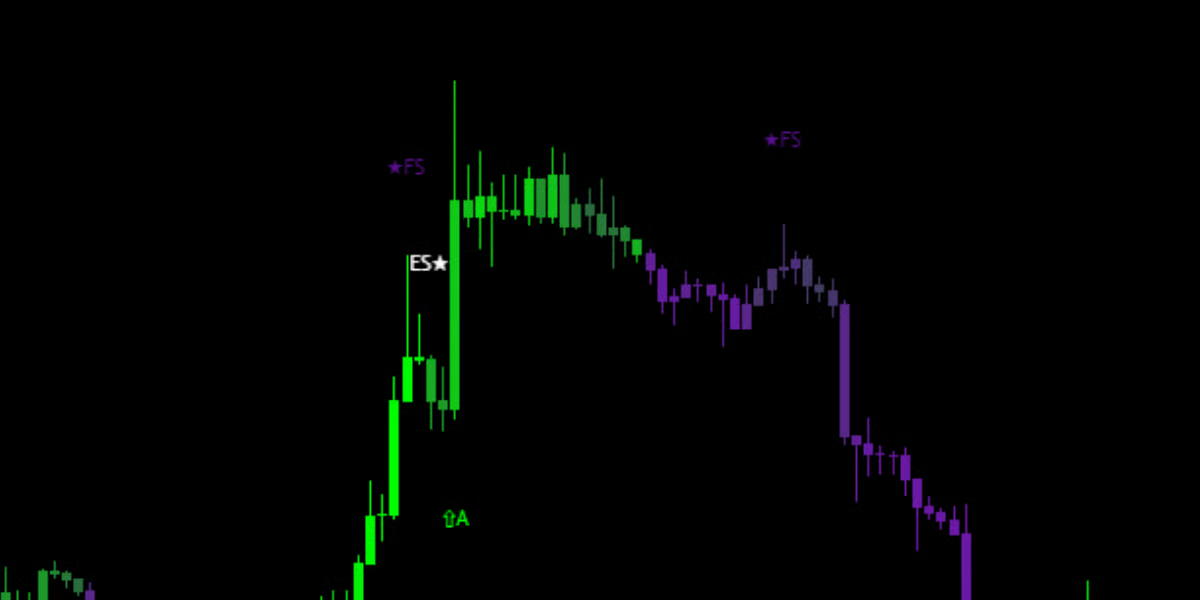
When a valid pattern is detected, a small label will appear above or below the candle.🔹 Reversal Stars (3-Candle Formations)
These are powerful multi-candle reversal patterns often found at swing highs or lows.- MS★ (Morning Star): A bullish bottoming pattern indicating the end of a downtrend.
- ES★ (Evening Star): A bearish topping pattern indicating the end of an uptrend.
- ★FS (Falling Star): A bearish rejection candle with a long upper wick, found at highs.
🔹 Hammer & Hanging Man
- ■H (Hammer): A bullish pin-bar found at the bottom of a trend. It shows that sellers pushed price down, but buyers absorbed the pressure and pushed it back up.
- □HM (Hanging Man): The bearish counterpart to the hammer, found at the top of an uptrend. It signals potential exhaustion.
🔹 Absorption (Volume-Based)
- ⇧A (Bullish Absorption): A proprietary Viper pattern. It detects when a candle engulfs the previous range with significant volume, indicating aggressive institutional buying.
- ⇩A (Bearish Absorption): The inverse, indicating aggressive institutional selling.
🔹 Doji Family (Indecision)
- ☆DS (Doji Star): Represents total market indecision. Often precedes a volatile move.
- DD◇ (Dragonfly Doji): Bullish rejection of lower prices.
- ◇DG (Gravestone Doji): Bearish rejection of higher prices.