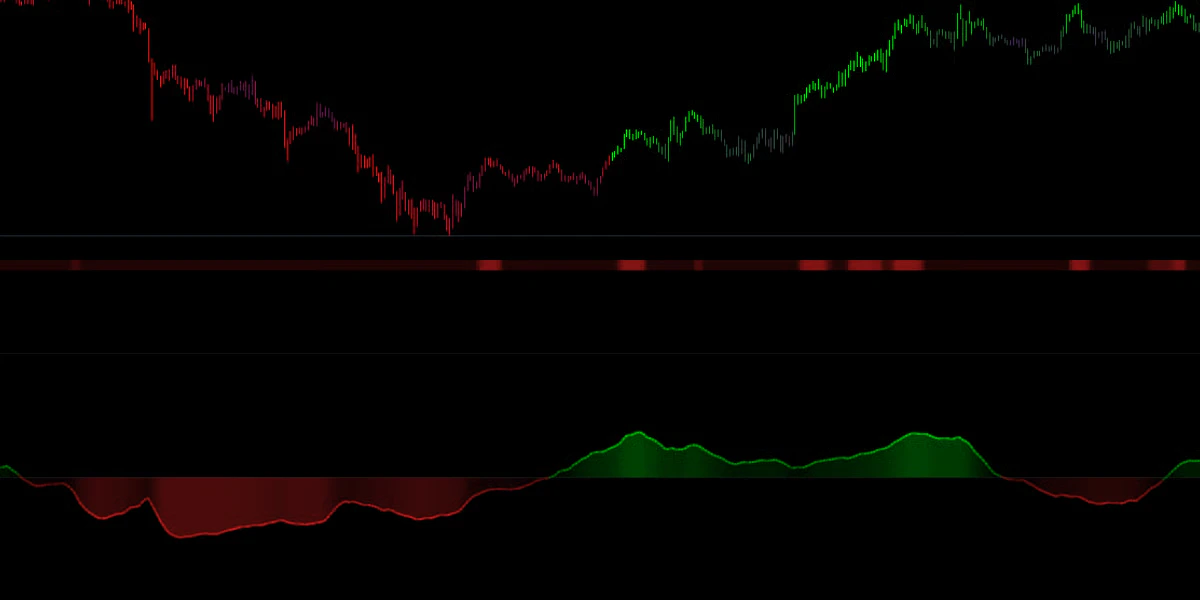
Price can lie, but volume rarely does. The Money Flow Wave is a secondary engine that runs in the background of the oscillator pane, appearing as a shaded wave behind the main Core.
While the Core Oscillator tracks Price Momentum (how fast price is changing), the Money Flow Wave tracks Volume Pressure (is money actually entering or leaving the asset?)
How to Read It
The wave oscillates around the zero line, independent of the Core line.
- Green Wave (Above Zero): Net Inflow. Buying volume is dominating. Institutions are accumulating.
- Red/Purple Wave (Below Zero): Net Outflow. Selling volume is dominating. Institutions are distributing.
Effort vs. Result
The most powerful way to use the Money Flow Wave is to compare it to the Price Action or the Core Oscillator. This reveals “Effort vs. Result” anomalies.
✅ Healthy Trend (Confirmation)
- Scenario: Price is making higher highs, and the Money Flow Wave is also rising and green.
- Verdict: Real Move. The price increase is supported by rising volume. It is safe to look for continuation trades.
⚠️ The “Fake-Out” (Divergence)
- Scenario: Price makes a new High, but the Money Flow Wave makes a Lower High (or stays Red).
- Verdict: Trap. Price is being pushed up, but “Smart Money” is not participating (or is secretly selling into the rally). This is often an immediate precursor to a violent reversal.
Strategy Tip: If the Core Oscillator (Ribbon) crosses up for a Buy Signal, but the Money Flow Wave is deep Red, skip the trade. A buy signal without money flow support has a high failure rate.
.png?fit=max&auto=format&n=BTEMalYyM0xskXeS&q=85&s=3495b9a1f1230446e6de7883f20fc8cd)