.png?fit=max&auto=format&n=BTEMalYyM0xskXeS&q=85&s=3495b9a1f1230446e6de7883f20fc8cd)
Structure Types
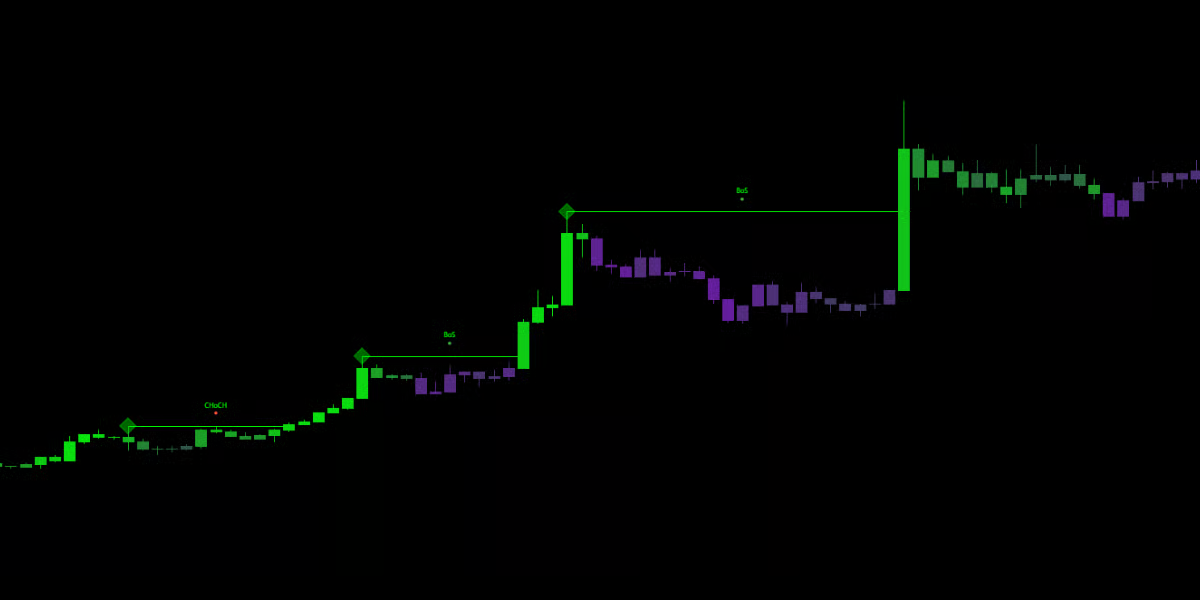
The indicator splits structure into two distinct layers, allowing you to see both the “Forest” and the “Trees.”🔹 External Structure (Major)
- Visual: Solid Lines with Large Labels.
- Definition: These are the major swing points (Swing Highs/Lows) that define the overall trend bias.
- Usage: Use this to determine the dominant direction. If External Structure is making Higher Highs, you should prioritize Long trades.
🔹 Internal Structure (Minor)
- Visual: Dotted Lines with Smaller Labels.
- Definition: These are the micro-movements inside the major swings. Price often shifts internal structure (Internal CHoCH) before the major trend reverses.
- Usage: Use this for Entry Timing. A bullish Internal CHoCH at a key support level is often the earliest signal of a reversal.
Terminology
If you are new to Smart Money Concepts, here is how to read the labels on your chart:BoS (Break of Structure)
- Meaning: Trend Continuation.
- Context:
- Bullish BoS: Price has broken above a previous High. The Uptrend is healthy.
- Bearish BoS: Price has broken below a previous Low. The Downtrend is healthy.
CHoCH (Change of Character)
- Meaning: Trend Reversal Signal.
- Context: This is the first sign that the opposing party is taking control.
- Bullish CHoCH: Price was in a downtrend but has now powered up through a valid Lower High.
- Bearish CHoCH: Price was in an uptrend but has now crashed down through a valid Higher Low.
Structure Strength (The Breakout Dot)
Not all structural breaks are created equal. A candle that blasts through a resistance level is very different from one that barely closes a pip above it. Mkt-Viper Edge analyzes the Velocity of every break. You will see a small colored circle (●) appear next to every BoS or CHoCH label. This indicates the conviction of the move:- 🟢 Green Dot (Strong Break): Price has closed significantly past the structure level with strength. This confirms strong momentum and a high probability that the trend will continue.
- 🟡 Yellow Dot (Standard Break): Price has closed past the level with a normal range. The break is valid, but standard caution applies.
- 🔴 Red Dot (Weak Break): Warning Signal. Price has barely closed past the level. This indicates a lack of momentum and a higher risk of a “Fake-out” or Swing Failure Pattern (SFP). When you see a Red Dot, wait for the next candle to confirm the move before entering.
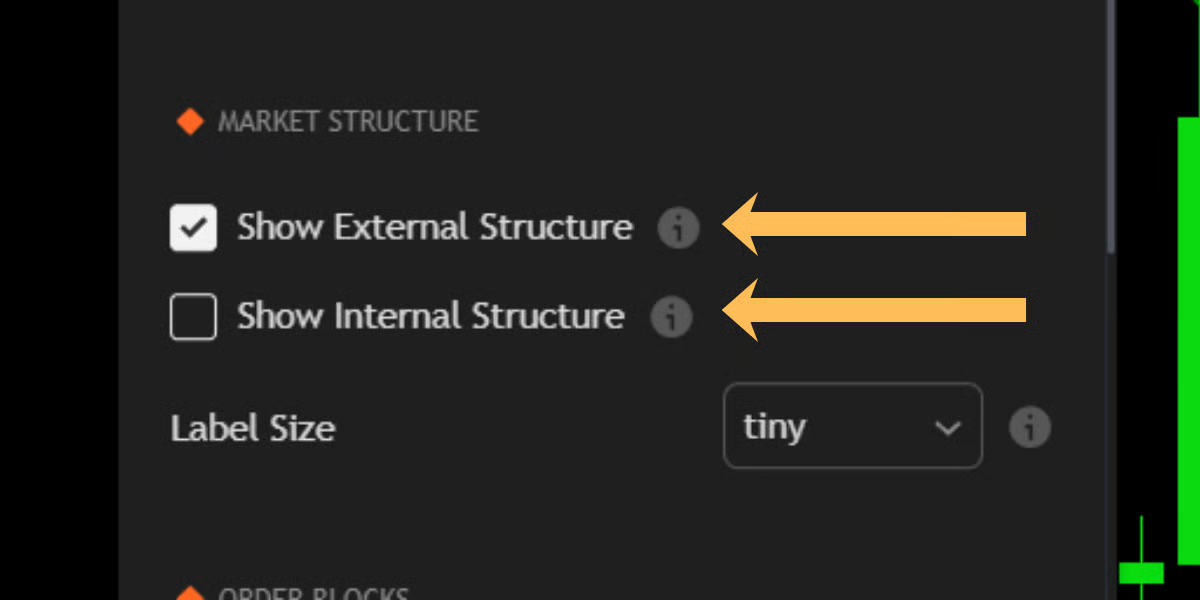
Configuration & Settings
You can customize the structure engine in the “Market Structure” settings group.- Show External Structure: Toggle the major trend lines (Default: ON).
- Show Internal Structure: Toggle the minor sub-structure (Default: OFF). Turn this on if you are a scalper looking for lower-timeframe entries.
- Label Size: Adjust the text size of the BoS/CHoCH labels to keep your chart clean.