.png?fit=max&auto=format&n=BTEMalYyM0xskXeS&q=85&s=3495b9a1f1230446e6de7883f20fc8cd)
Overview
The first 15 minutes of the trading session are often the most volatile and significant. This is when institutional orders hit the market, establishing the initial boundaries of the day. The Viper ORB Engine automatically visualizes this battleground. It captures the High and Low of the first 15 minutes of the trading session (M15 candle) and projects these levels forward. These lines act as the definitive “line in the sand” for the rest of the trading day.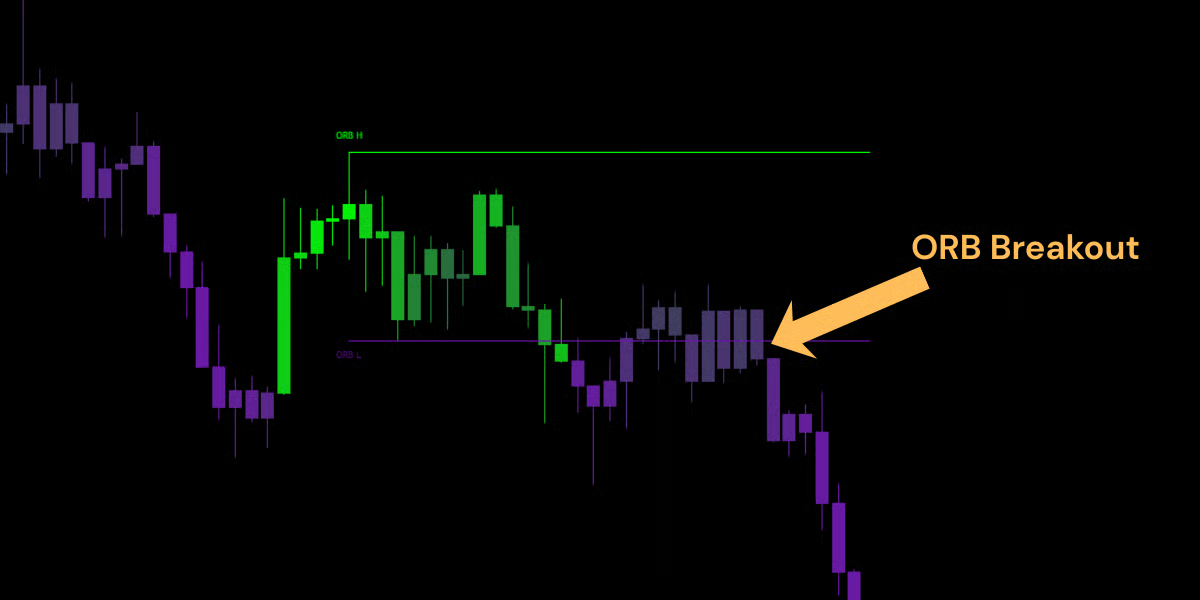
How It Works (The 15-Minute Rule)
The engine is hard-coded to analyze the 15-Minute Timeframe, regardless of what chart you are looking at.- ORB High (Green Line): The highest price reached during the first 15 minutes. Breaking above this suggests buyers are in control of the day.
- ORB Low (Red Line): The lowest price reached during the first 15 minutes. Breaking below this suggests sellers are in control.
The Delayed Trigger Protocol
Important Note: The ORB lines will not appear instantly at the market open. The engine must wait for the first 15-minute candle to close to confirm the range.- Example (New York Session): If the market opens at 09:30, the lines will appear on your chart at 09:45.
- Once confirmed, the lines backfill to the open and extend forward to the current time.
Customization & Sessions
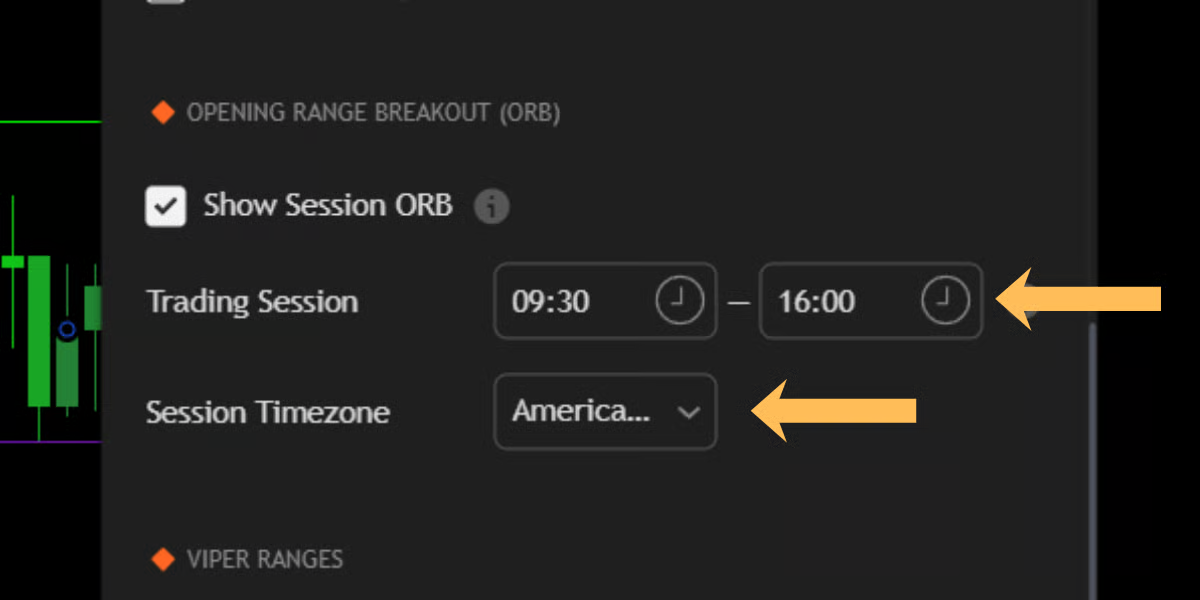
You can fully customize which session defines your “Opening Range” in the settings panel.- Trading Session: Define your start and end times.
- Default: 0930-1600 (Standard US Stock Market Hours).
- Crypto: You can set this to 0000-0015 to catch the daily UTC open.
- Session Timezone: Ensure this matches the exchange you are trading.
- Options: New York, London, Tokyo, UTC.