.png?fit=max&auto=format&n=BTEMalYyM0xskXeS&q=85&s=3495b9a1f1230446e6de7883f20fc8cd)
Supported Structures
The engine automatically detects and labels the following geometric structures:🔹 Wedges (Reversal)
- Falling Wedge: A structure with lower highs and lower lows contracting into a point.
- Bias: Bullish. Usually breaks to the upside.
- Rising Wedge: A structure with higher highs and higher lows contracting into a point.
- Bias: Bearish. Usually breaks to the downside.
🔹 Triangles (Continuation)
- Symmetrical Triangle: Price compressing with lower highs and higher lows.
- Bias: Neutral. Represents a “coiling” of energy before a massive expansion in either direction.
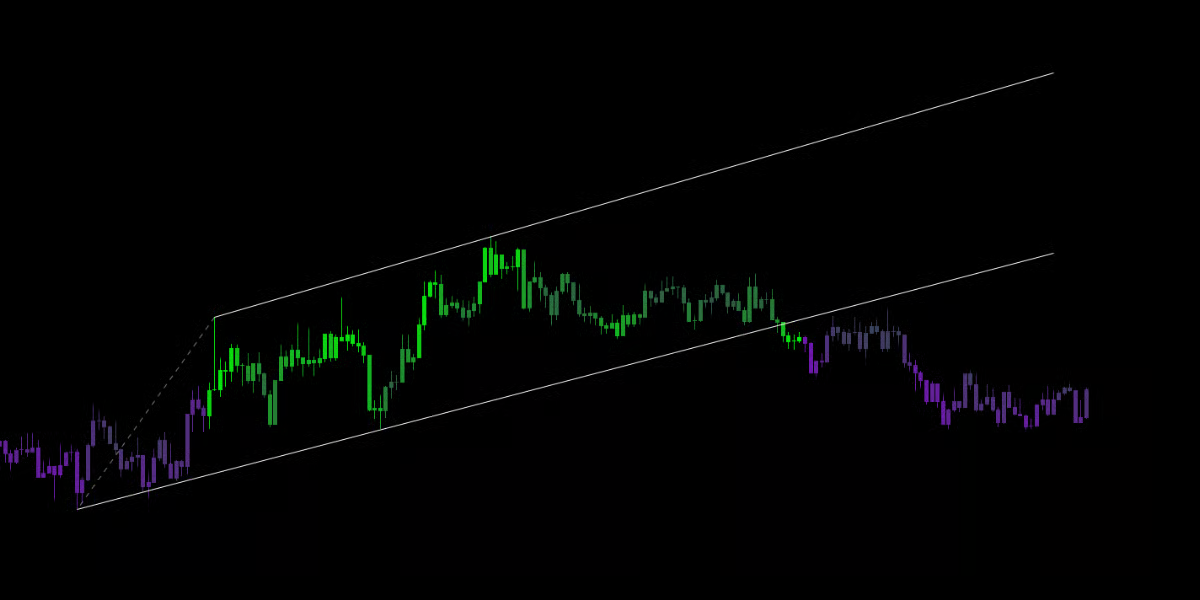
🔹 Channels (Trend)
- Parallel Channel: Price bouncing between two parallel trendlines.
- Strategy: Trade the bounces. Buy at the bottom line, Sell at the top line.
🔹 Expanding (Volatility)
- Broadening Wedge: The opposite of a triangle. Highs get higher and lows get lower.
- Bias: High Volatility / Confusion. Represents increasing market instability.