> ## Documentation Index
> Fetch the complete documentation index at: https://docs.mkt-viper.com/llms.txt
> Use this file to discover all available pages before exploring further.
# The Core Oscillator
> What is the Viper Core Momentum Oscillator?
The **Viper Core** is the central processing engine of the Mkt-Viper suite. Unlike conventional oscillators that rely on static lookback periods (RSI, Stochastics), the Viper Core utilizes a proprietary **Viper Flow** algorithm.
This engine calculates the **Dynamic Torque** of the market—measuring the force required to move price away from its equilibrium. It incorporates an internal **Density Filter**, which mathematically rejects low-volume noise and single-candle anomalies. The result is a highly adaptive waveform that visualizes the true structural momentum of the asset, unpolluted by market microstructure noise.
 ### How to Read the Core
The Core tells you the immediate health of the price action.
* **Green Line/Ribbon:** **Bullish Momentum.** Price is expanding upwards relative to its recent average.
* **Red Line/Ribbon:** **Bearish Momentum.** Price is expanding downwards.
* **The Zero Line Cross:** The most fundamental signal.
* Crossing from Negative to Positive (Up) signals a shift to an Uptrend.
* Crossing from Positive to Negative (Down) signals a shift to a Downtrend.
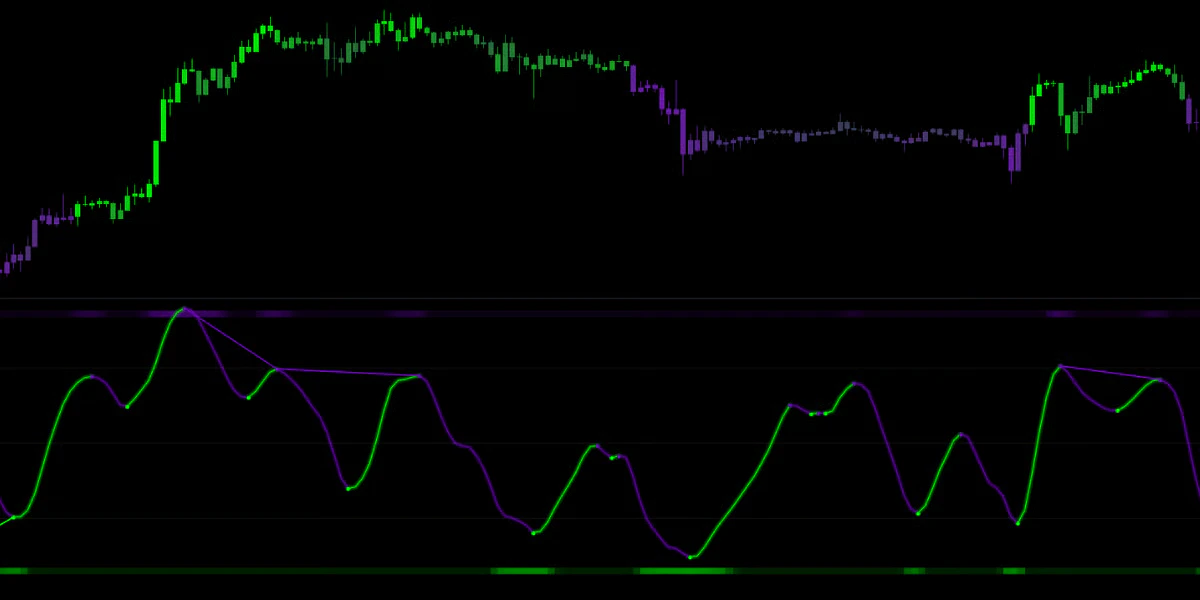
### Overbought & Oversold Zones (The Extremes)
The background of the oscillator features dynamic "Glow Zones" that activate when momentum reaches statistical extremes.
### How to Read the Core
The Core tells you the immediate health of the price action.
* **Green Line/Ribbon:** **Bullish Momentum.** Price is expanding upwards relative to its recent average.
* **Red Line/Ribbon:** **Bearish Momentum.** Price is expanding downwards.
* **The Zero Line Cross:** The most fundamental signal.
* Crossing from Negative to Positive (Up) signals a shift to an Uptrend.
* Crossing from Positive to Negative (Down) signals a shift to a Downtrend.
### Overbought & Oversold Zones (The Extremes)
The background of the oscillator features dynamic "Glow Zones" that activate when momentum reaches statistical extremes.
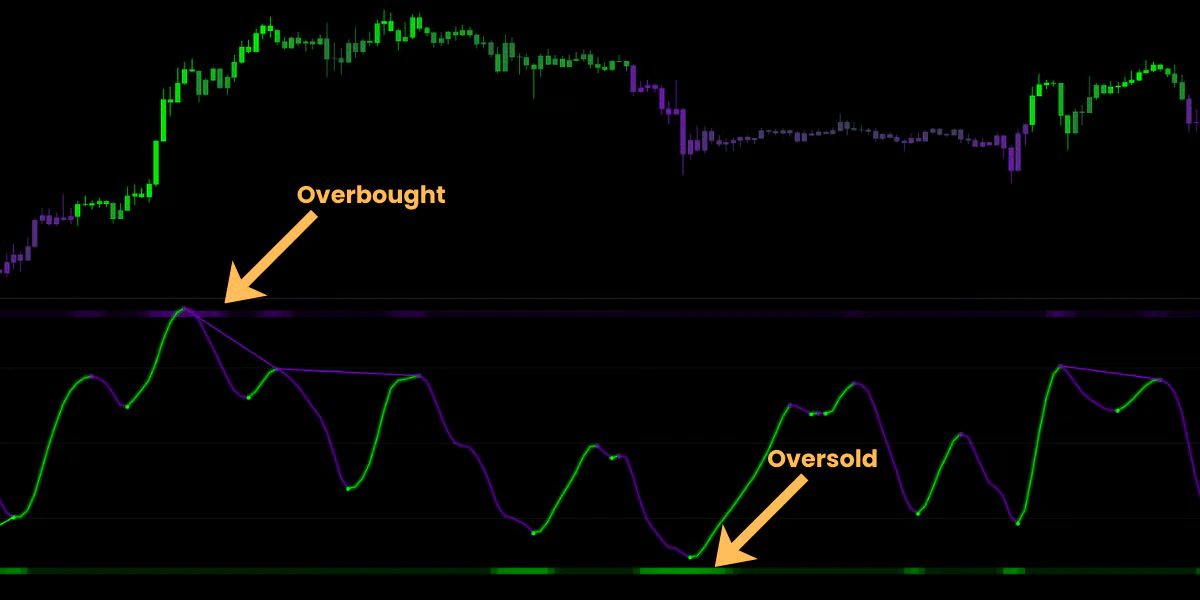 * **Overbought Zone:** When the Core pushes high into the upper shaded zone, the move is becoming overextended. Momentum is stretching too far, and a pullback is statistically likely.
* **Oversold Zone:** When the Core pushes deep into the lower shaded zone, sellers are exhausting themselves. A bounce is likely.
**Warning:** In a strong trend, the Core can stay Overbought for a long time (Pegging). Do not short just because it is high. Wait for the color to flip to confirm the momentum has actually broken.
### Visual Modes
You can customize the look of the Core in the settings to match your preference:
* **Overbought Zone:** When the Core pushes high into the upper shaded zone, the move is becoming overextended. Momentum is stretching too far, and a pullback is statistically likely.
* **Oversold Zone:** When the Core pushes deep into the lower shaded zone, sellers are exhausting themselves. A bounce is likely.
**Warning:** In a strong trend, the Core can stay Overbought for a long time (Pegging). Do not short just because it is high. Wait for the color to flip to confirm the momentum has actually broken.
### Visual Modes
You can customize the look of the Core in the settings to match your preference:
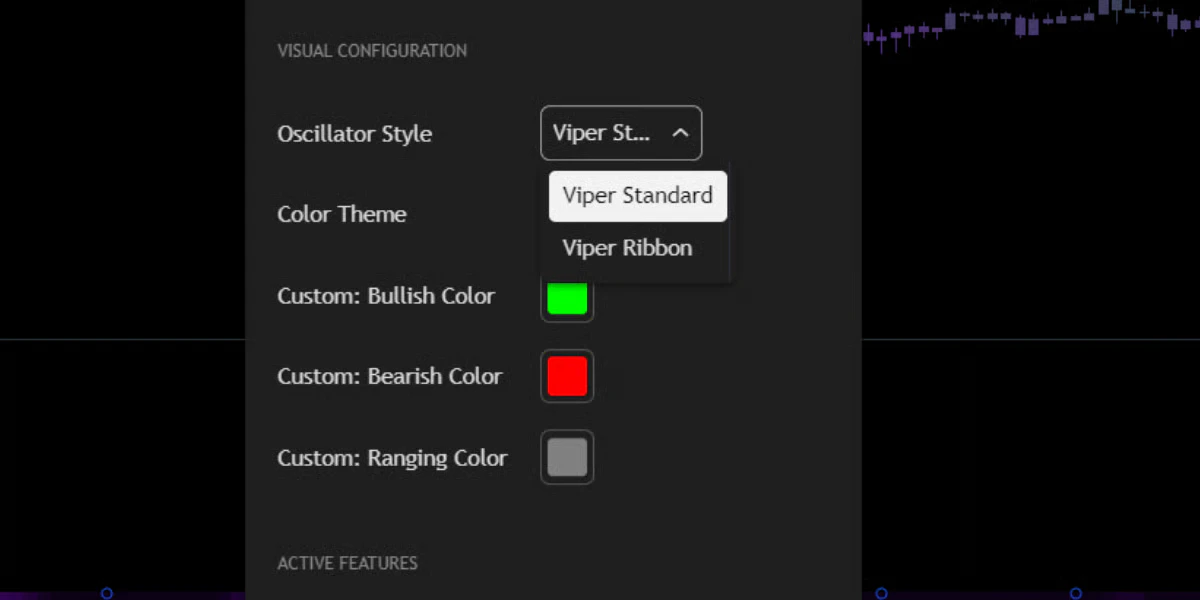 #### 🔹 Viper Standard
**Default Style.**
* Displays a single, sleek line with a neon glow effect.
* **Best For:** Traders who want a clean, modern look and focus primarily on Divergences and Extremes.
#### 🔹 Viper Ribbon
**Classic Style.**
* Displays two lines: The **Fast Core** and a **Slower Signal Trail**.
* The space between them is shaded.
* **Best For:** Spotting "Crossovers." When the Fast line crosses the Slow line, it provides an earlier entry signal than a simple color flip.
#### 🔹 Viper Standard
**Default Style.**
* Displays a single, sleek line with a neon glow effect.
* **Best For:** Traders who want a clean, modern look and focus primarily on Divergences and Extremes.
#### 🔹 Viper Ribbon
**Classic Style.**
* Displays two lines: The **Fast Core** and a **Slower Signal Trail**.
* The space between them is shaded.
* **Best For:** Spotting "Crossovers." When the Fast line crosses the Slow line, it provides an earlier entry signal than a simple color flip.