> ## Documentation Index
> Fetch the complete documentation index at: https://docs.mkt-viper.com/llms.txt
> Use this file to discover all available pages before exploring further.
# Candle Patterns
> How to use the Viper Automatic Candle Patterns
Price action is the language of the market. The **Viper Candle Pattern Engine** translates this language in real-time.
Instead of cluttering your chart with every textbook definition of a pattern, this engine uses **Smart Context Logic**. It only looks for specific patterns where they make sense (e.g., looking for Bullish Hammers only during a downtrend, or Hanging Men only during an uptrend). This drastically reduces false signals and helps you identify key reversal points.
 IMPORTANT!
Do not consider these patterns as buy or sell signals. Consider them as early warning signs showing that a trend could be weakening and opposing bullish or bearish pressure may be stepping into the market. If you see these signals, look for other confirmations of a potential reversal.
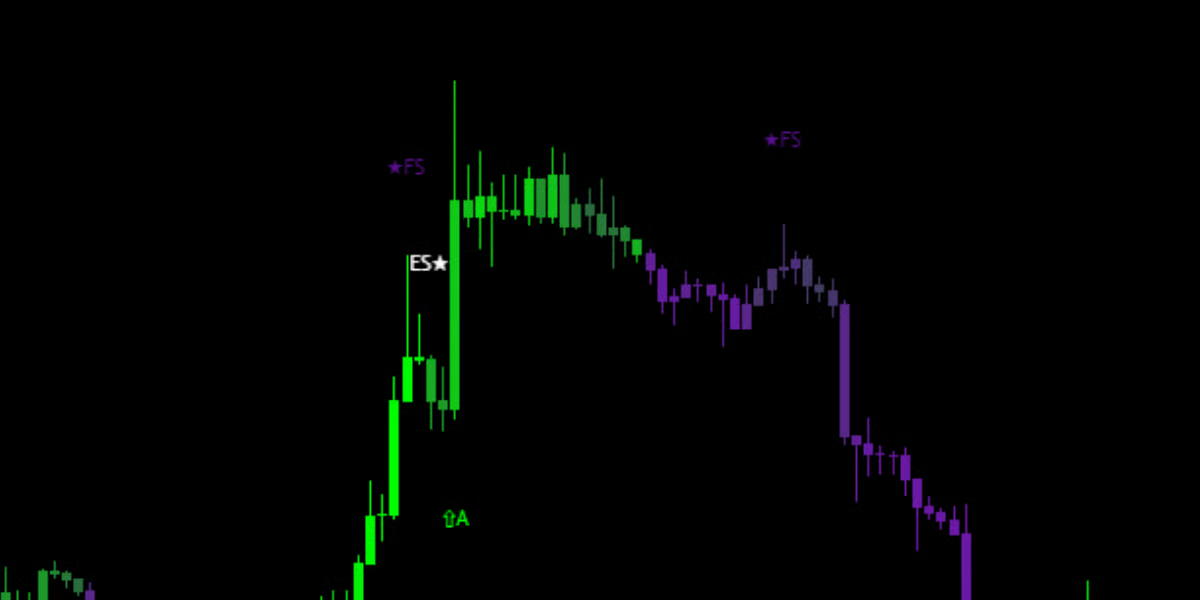
### Pattern Library & Symbols
When a valid pattern is detected, a small label will appear above or below the candle.
#### 🔹 Reversal Stars (3-Candle Formations)
These are powerful multi-candle reversal patterns often found at swing highs or lows.
* **MS★ (Morning Star):** A bullish bottoming pattern indicating the end of a downtrend.
* **ES★ (Evening Star):** A bearish topping pattern indicating the end of an uptrend.
* **★FS (Falling Star):** A bearish rejection candle with a long upper wick, found at highs.
#### 🔹 Hammer & Hanging Man
* **■H (Hammer):** A bullish pin-bar found at the bottom of a trend. It shows that sellers pushed price down, but buyers absorbed the pressure and pushed it back up.
* **□HM (Hanging Man):** The bearish counterpart to the hammer, found at the top of an uptrend. It signals potential exhaustion.
#### 🔹 Absorption (Volume-Based)
* **⇧A (Bullish Absorption):** A proprietary Viper pattern. It detects when a candle engulfs the previous range with **significant volume**, indicating aggressive institutional buying.
* **⇩A (Bearish Absorption):** The inverse, indicating aggressive institutional selling.
#### 🔹 Doji Family (Indecision)
* **☆DS (Doji Star):** Represents total market indecision. Often precedes a volatile move.
* **DD◇ (Dragonfly Doji):** Bullish rejection of lower prices.
* **◇DG (Gravestone Doji):** Bearish rejection of higher prices.
IMPORTANT!
Do not consider these patterns as buy or sell signals. Consider them as early warning signs showing that a trend could be weakening and opposing bullish or bearish pressure may be stepping into the market. If you see these signals, look for other confirmations of a potential reversal.
### Pattern Library & Symbols
When a valid pattern is detected, a small label will appear above or below the candle.
#### 🔹 Reversal Stars (3-Candle Formations)
These are powerful multi-candle reversal patterns often found at swing highs or lows.
* **MS★ (Morning Star):** A bullish bottoming pattern indicating the end of a downtrend.
* **ES★ (Evening Star):** A bearish topping pattern indicating the end of an uptrend.
* **★FS (Falling Star):** A bearish rejection candle with a long upper wick, found at highs.
#### 🔹 Hammer & Hanging Man
* **■H (Hammer):** A bullish pin-bar found at the bottom of a trend. It shows that sellers pushed price down, but buyers absorbed the pressure and pushed it back up.
* **□HM (Hanging Man):** The bearish counterpart to the hammer, found at the top of an uptrend. It signals potential exhaustion.
#### 🔹 Absorption (Volume-Based)
* **⇧A (Bullish Absorption):** A proprietary Viper pattern. It detects when a candle engulfs the previous range with **significant volume**, indicating aggressive institutional buying.
* **⇩A (Bearish Absorption):** The inverse, indicating aggressive institutional selling.
#### 🔹 Doji Family (Indecision)
* **☆DS (Doji Star):** Represents total market indecision. Often precedes a volatile move.
* **DD◇ (Dragonfly Doji):** Bullish rejection of lower prices.
* **◇DG (Gravestone Doji):** Bearish rejection of higher prices.