> ## Documentation Index
> Fetch the complete documentation index at: https://docs.mkt-viper.com/llms.txt
> Use this file to discover all available pages before exploring further.
# Smart Grid Support & Resistance
> What is Viper's Smart Grid Support and Resistance?
The **Mkt-Viper Smart Grid** is built different. It uses an **Intelligent Filtering Engine** to locate only the most significant reaction levels. It doesn't just look for price pivots; it looks for **Volume Validation**. A level is only drawn if the market validated that price point with a surge of transactional volume.
 ### Volume Validation
The engine runs a background check on every potential pivot point.
This automatically filters out weak, retail-driven turning points. The Smart Grid only plots levels where **Institutional Money** stepped in to reverse the price.
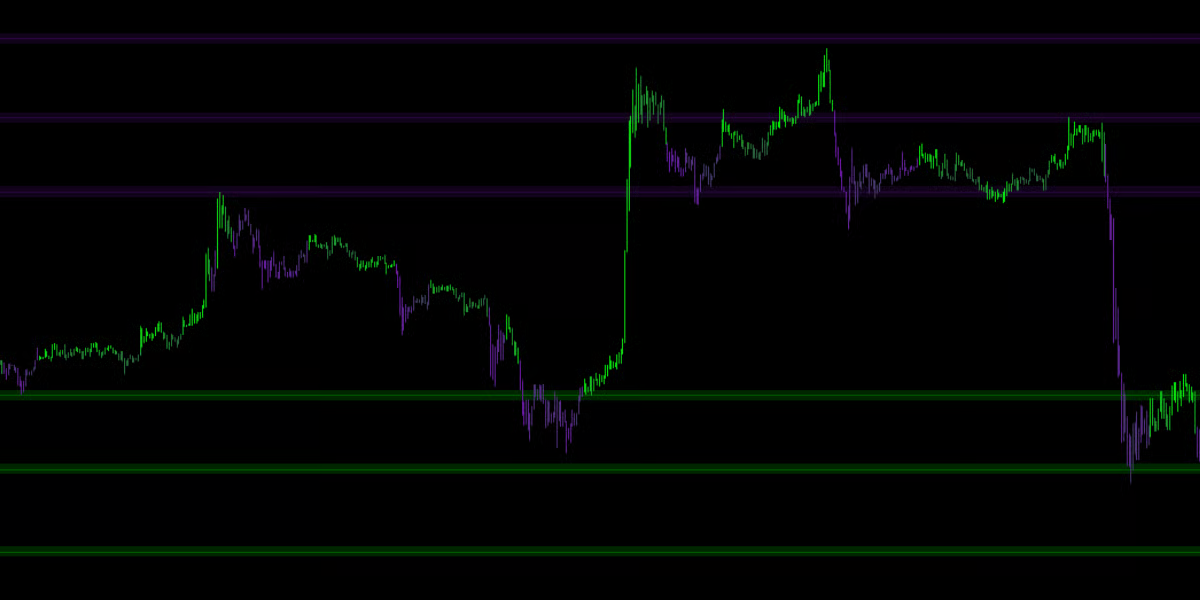
### The Holographic View
To keep your chart pristine, Mkt-Viper Edge employs a "Holographic" rendering system.
* **Infinite Memory:** The engine remembers historical levels from hundreds of bars ago (Key Levels).
* **Dynamic Focus:** Even though it remembers everything, it **only displays the lines closest to the current price**.
* **Auto-Limit:** By default, it shows the **6 most relevant Resistance lines** above you and the **6 most relevant Support lines** below you. As price moves, lines further away fade out, and new relevant lines fade in. This gives you deep historical context without the visual clutter.
### Volume Validation
The engine runs a background check on every potential pivot point.
This automatically filters out weak, retail-driven turning points. The Smart Grid only plots levels where **Institutional Money** stepped in to reverse the price.
### The Holographic View
To keep your chart pristine, Mkt-Viper Edge employs a "Holographic" rendering system.
* **Infinite Memory:** The engine remembers historical levels from hundreds of bars ago (Key Levels).
* **Dynamic Focus:** Even though it remembers everything, it **only displays the lines closest to the current price**.
* **Auto-Limit:** By default, it shows the **6 most relevant Resistance lines** above you and the **6 most relevant Support lines** below you. As price moves, lines further away fade out, and new relevant lines fade in. This gives you deep historical context without the visual clutter.
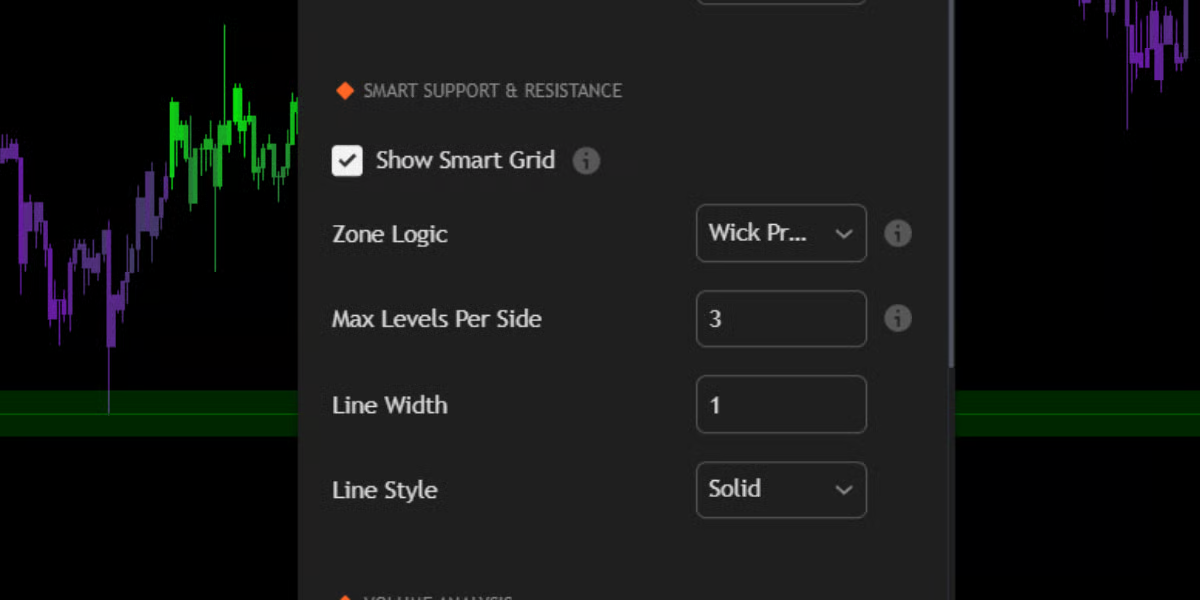 ### Settings
#### **Zone Logic: Wick vs. Average**
Markets rarely turn at a single micro-pip; they turn within "Zones." You can customize how the Smart Grid handles these zones in the settings:
#### 🔹 Wick Precision (Default)
* **Behavior:** The line snaps to the **Absolute High/Low** of the wicks in that zone.
* **Best For:** Sniper entries. This mode assumes that the extreme wick is the point where liquidity was grabbed.
#### 🔹 Average Center
* **Behavior:** The line floats in the **Weighted Center** of the cluster.
* **Best For:** General trend analysis. This shows the "Fair Value" of the zone rather than the extreme edge.
### Touch Count & Strength
The Smart Grid learns over time.
1. **Creation:** A line is born when a Volume-Validated Pivot occurs.
2. **Reinforcement:** If price returns to that level and bounces again, the engine detects a "Touch."
3. **Merging:** The engine automatically merges nearby touches into a single, stronger level.
4. **Key Level Status:** If a level survives **5 or more touches**, it is flagged internally as a "Key Level" and is prioritized in the display logic.
**Strategy: The Grid Walk**
The Smart Grid provides a roadmap for price travel.
* **Range Trading:** In a sideways market, simply Buy at the closest Bullish Line (Support) and Sell at the closest Bearish Line (Resistance).
* **Break & Retest:** In a trending market, wait for a candle to close firmly past a Grid Line. That broken Resistance line will now flip to become Support. Place your entry on the retest of that line.
### Settings
#### **Zone Logic: Wick vs. Average**
Markets rarely turn at a single micro-pip; they turn within "Zones." You can customize how the Smart Grid handles these zones in the settings:
#### 🔹 Wick Precision (Default)
* **Behavior:** The line snaps to the **Absolute High/Low** of the wicks in that zone.
* **Best For:** Sniper entries. This mode assumes that the extreme wick is the point where liquidity was grabbed.
#### 🔹 Average Center
* **Behavior:** The line floats in the **Weighted Center** of the cluster.
* **Best For:** General trend analysis. This shows the "Fair Value" of the zone rather than the extreme edge.
### Touch Count & Strength
The Smart Grid learns over time.
1. **Creation:** A line is born when a Volume-Validated Pivot occurs.
2. **Reinforcement:** If price returns to that level and bounces again, the engine detects a "Touch."
3. **Merging:** The engine automatically merges nearby touches into a single, stronger level.
4. **Key Level Status:** If a level survives **5 or more touches**, it is flagged internally as a "Key Level" and is prioritized in the display logic.
**Strategy: The Grid Walk**
The Smart Grid provides a roadmap for price travel.
* **Range Trading:** In a sideways market, simply Buy at the closest Bullish Line (Support) and Sell at the closest Bearish Line (Resistance).
* **Break & Retest:** In a trending market, wait for a candle to close firmly past a Grid Line. That broken Resistance line will now flip to become Support. Place your entry on the retest of that line.