> ## Documentation Index
> Fetch the complete documentation index at: https://docs.mkt-viper.com/llms.txt
> Use this file to discover all available pages before exploring further.
# Money Flow Matrix
> What is the Money Flow Matrix?
Candlestick charts only tell half the story. They show you where price went, but not how hard it was pushed.
The **Viper Money Flow Matrix** is a next-generation **Institutional Order Flow Profile**. Unlike standard Volume Profiles that just show a blob of data, the Matrix splits the data into two distinct "Wings" to visualize the battle between buyers and sellers in real-time. It anchors to the right side of your chart, giving you a constant readout of the liquidity landscape over the last 500+ bars.
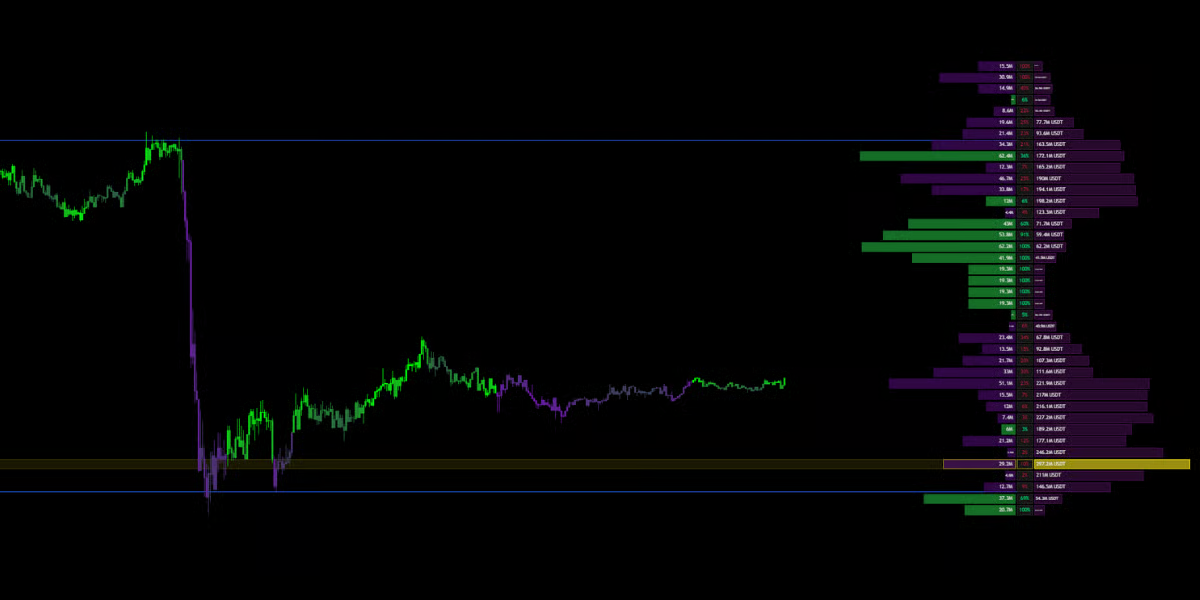 ### **How to Read the Matrix**
The Matrix is divided into horizontal rows. Each row represents a specific price level.
### **How to Read the Matrix**
The Matrix is divided into horizontal rows. Each row represents a specific price level.
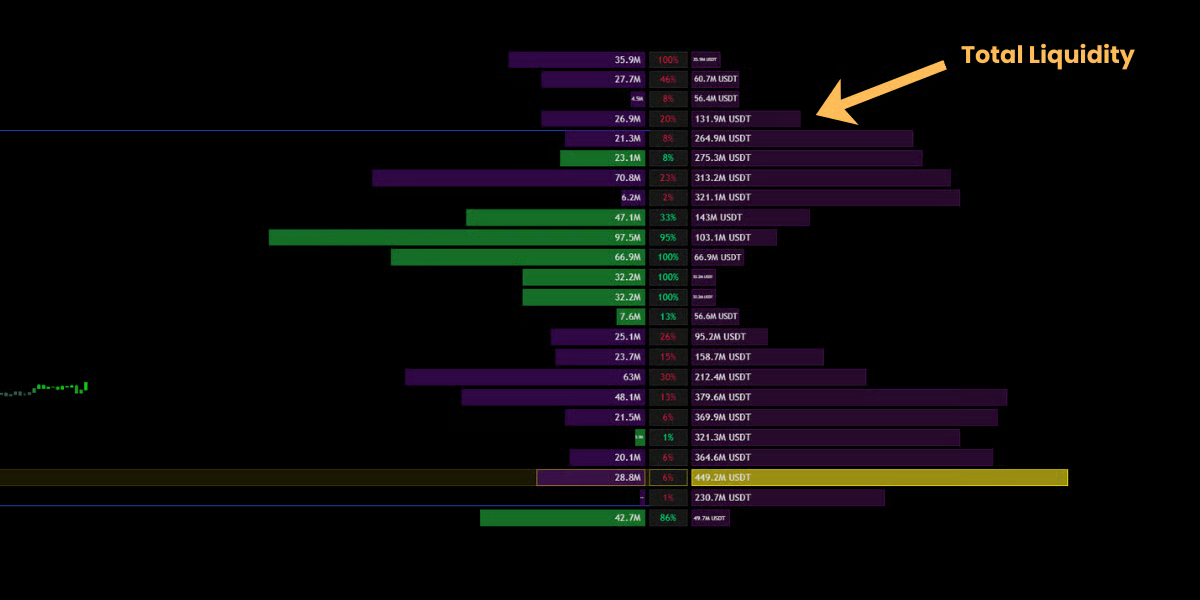 #### 🔹 The Right Wing (Total Liquidity)
* **What it shows:** **Total Volume (History).**
* **Visual:** The bars extending to the **Right**.
* **Meaning:** This represents the total amount of shares, coins or contracts traded at this price.
* **Interpretation:**
* Long Bars (High Volume Nodes): High liquidity zones. Price likes to hang out here (Acceptance).
* Short Bars (Low Volume Nodes): Low liquidity zones. Price tends to speed through these areas (Rejection).\\
#### 🔹 The Right Wing (Total Liquidity)
* **What it shows:** **Total Volume (History).**
* **Visual:** The bars extending to the **Right**.
* **Meaning:** This represents the total amount of shares, coins or contracts traded at this price.
* **Interpretation:**
* Long Bars (High Volume Nodes): High liquidity zones. Price likes to hang out here (Acceptance).
* Short Bars (Low Volume Nodes): Low liquidity zones. Price tends to speed through these areas (Rejection).\\
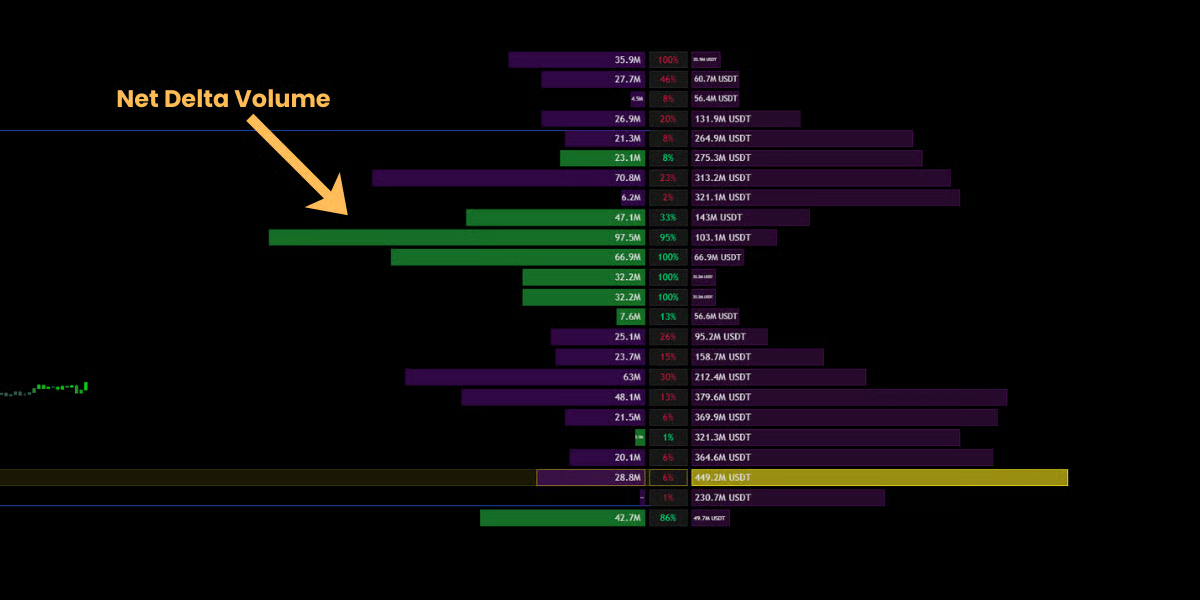 #### 🔹 The Left Wing (Net Delta)
* **What it shows:** **Aggression (The Fight).**
* **Visual:** The bars extending to the **Left** (Green or Purple).
* **Meaning:** This shows the **Net Delta** (Buy Volume minus Sell Volume).
* **Interpretation:**
* Green Bar (Left): Aggressive Buyers controlled this level.
* Purple Bar (Left): Aggressive Sellers controlled this level.
* Strategy: If price is approaching a resistance level, but the Left Wing shows massive Green bars, it suggests a breakout is imminent (Absorption).
#### 🔹 The Left Wing (Net Delta)
* **What it shows:** **Aggression (The Fight).**
* **Visual:** The bars extending to the **Left** (Green or Purple).
* **Meaning:** This shows the **Net Delta** (Buy Volume minus Sell Volume).
* **Interpretation:**
* Green Bar (Left): Aggressive Buyers controlled this level.
* Purple Bar (Left): Aggressive Sellers controlled this level.
* Strategy: If price is approaching a resistance level, but the Left Wing shows massive Green bars, it suggests a breakout is imminent (Absorption).
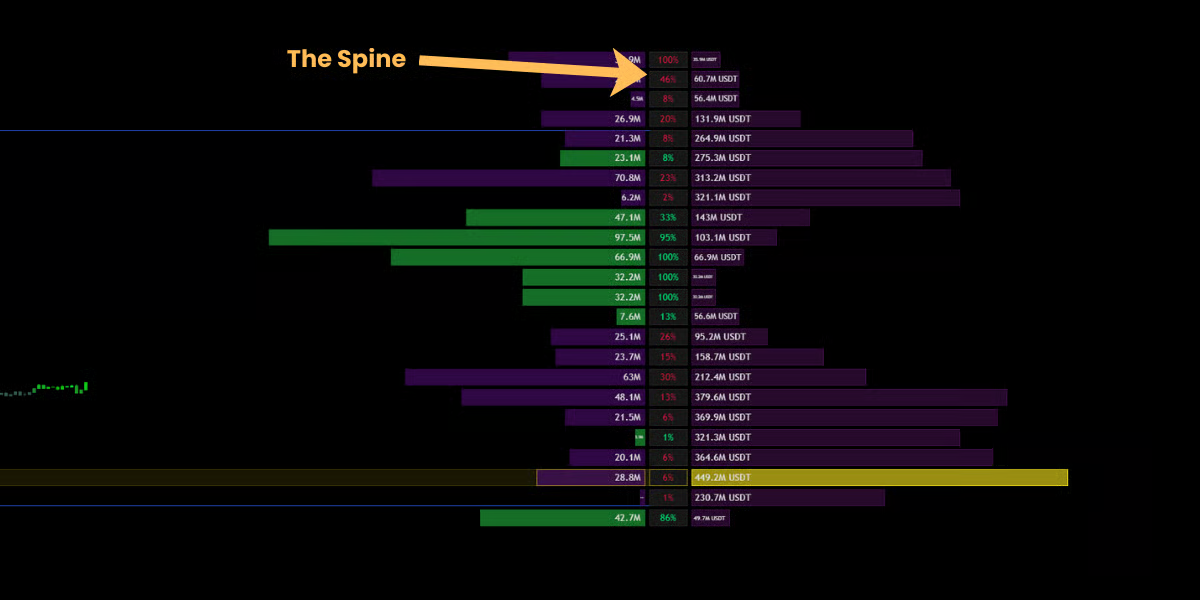 #### 🔹 The Spine (Conviction %)
* **Visual:** The central column of numbers between the wings.
* **Meaning:** This displays the **Conviction Ratio**—the percentage of total volume that was "one-sided."
* **Example:** If a level has a 90% spine value, it means it was a pure one-sided domination. If it shows 5%, it was a balanced tug-of-war.
### Key Reference Levels
The Matrix automatically highlights the most critical institutional levels.
#### 🔹 The Spine (Conviction %)
* **Visual:** The central column of numbers between the wings.
* **Meaning:** This displays the **Conviction Ratio**—the percentage of total volume that was "one-sided."
* **Example:** If a level has a 90% spine value, it means it was a pure one-sided domination. If it shows 5%, it was a balanced tug-of-war.
### Key Reference Levels
The Matrix automatically highlights the most critical institutional levels.
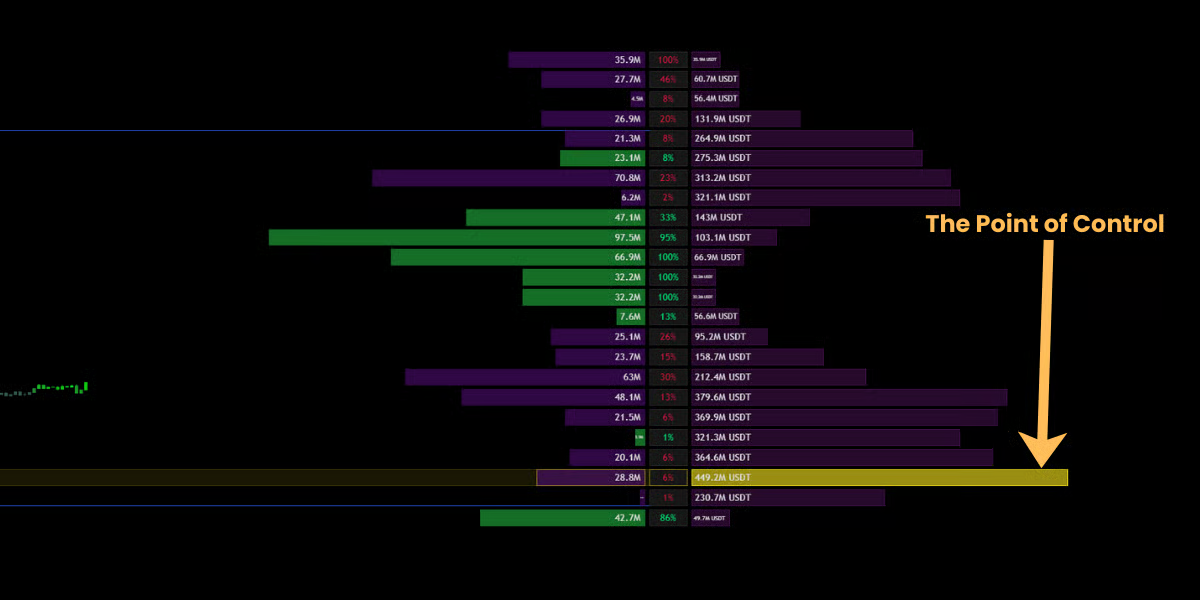 #### 👑 POC (Point of Control)
* **Visual:** The **Gold/Yellow Box**.
* **Definition:** The single price level with the highest volume in the entire range.
* **Significance:** The POC acts as the strongest "Magnet" on the chart. Price will constantly try to revert to this level.
* Trading: The POC is an excellent **Take Profit** target.
#### 👑 POC (Point of Control)
* **Visual:** The **Gold/Yellow Box**.
* **Definition:** The single price level with the highest volume in the entire range.
* **Significance:** The POC acts as the strongest "Magnet" on the chart. Price will constantly try to revert to this level.
* Trading: The POC is an excellent **Take Profit** target.
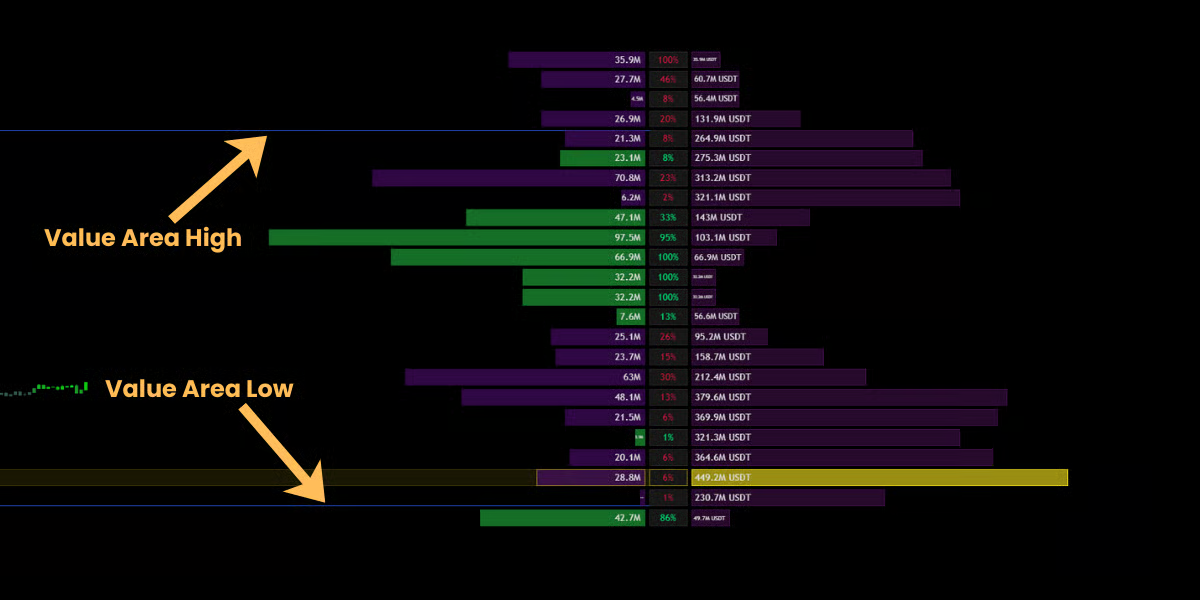 #### 🏛️ Value Area (VAH / VAL)
* **Visual:** The faint lines bracketing the bulk of the volume.
* **Definition:** This zone contains **70%** of all trading activity (Standard Deviation).
* **Significance:**
* **Inside Value:** Price is in "Fair Value." Expect chop or ranging behavior.
* **Outside Value:** If price breaks out of the Value Area, it enters "Price Discovery Mode" and trends often accelerate.
### Advanced Volume Settings
For institutional-grade analysis, Mkt-Viper Edge gives you granular control over how the Matrix calculates and displays data.
#### 🏛️ Value Area (VAH / VAL)
* **Visual:** The faint lines bracketing the bulk of the volume.
* **Definition:** This zone contains **70%** of all trading activity (Standard Deviation).
* **Significance:**
* **Inside Value:** Price is in "Fair Value." Expect chop or ranging behavior.
* **Outside Value:** If price breaks out of the Value Area, it enters "Price Discovery Mode" and trends often accelerate.
### Advanced Volume Settings
For institutional-grade analysis, Mkt-Viper Edge gives you granular control over how the Matrix calculates and displays data.
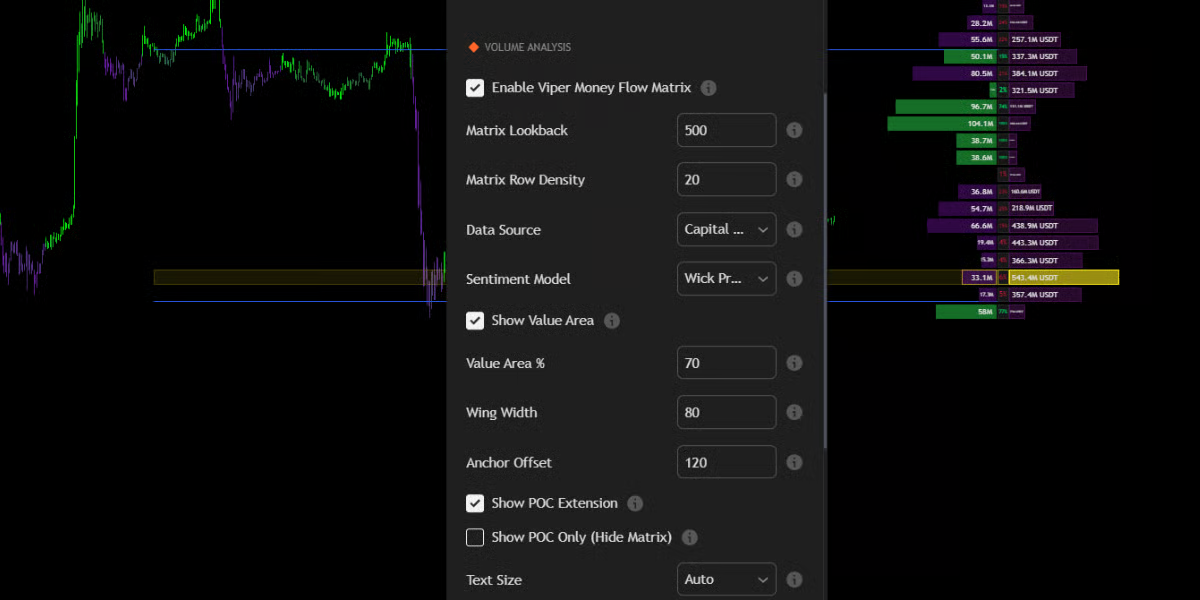 #### 🔹 Sentiment Model (The Logic)
This setting determines how the engine classifies volume as "Bullish" or "Bearish."
* **Wick Pressure (Default & Recommended):**
* **Logic:** A proprietary algorithm that analyzes the intra-bar battle. It compares the Upper Wick (selling pressure) to the Lower Wick (buying pressure) relative to the body.
* **Why use it:** This is far more accurate than standard volume. It can detect "Hidden Buying" inside a Red candle (e.g., a Hammer candle at the bottom of a downtrend).
* **Polarity (C > O):**
* **Logic:** Simple calculation. If Close > Open, all volume is counted as Bullish. If Close \< Open, all volume is counted as Bearish.
* **Why use it:** Standard "Up/Down Volume" analysis. Useful if you prefer the classic method used by most stock scanners.
#### 🔹 Matrix Lookback (Time Horizon)
* **Setting:** Matrix Lookback (Default: 500).
* **Definition:** This controls the **Depth of Vision** for the Money Flow Matrix. It determines exactly how many past candles are included in the volume calculation.
* Default (500 bars): Analyzes the last \~500 candles. On a 5m chart, this covers roughly 2 days of price action.
#### 🔹 Matrix Row Density
* **Setting:** Matrix Row Density (10-100).
* **What it does:** Controls the vertical resolution of the profile.
* **Low Density (10-20):** Groups volume into broad blocks. Best for identifying general support/resistance zones on higher timeframes.
* **High Density (50-100):** Splits volume into fine slivers. Best for "Sniper" entries where you need to see the exact price tick where volume dried up.
#### 🔹 Visual Layout & Anchoring
* **Anchor Offset:** Adjusts how far the Matrix sits from the current price bar. Increase this value to push the profile to the far right, preventing it from obscuring your recent candlesticks.
* **Wing Width:** Controls how wide the volume bars extend.
* **Text Size:** Set to **"Auto"** by default, but can be forced to Tiny, Small, or Normal depending on your screen resolution (4K vs. Laptop).
#### 🔹 Point of Control (POC) Modes
* **Show POC Extension:**
* When enabled, it draws a semi-transparent Gold Box extending from the POC to the current price. This visualizes the "Magnet Zone" clearly across the chart.
* **Show POC Only (Hide Matrix):**
* **Minimalist Mode.** If you find the full Volume Matrix too distracting, enable this toggle. It will hide all the volume bars and wings, leaving **only** the critical POC level and Value Area lines visible. This gives you the data without the clutter.
### Data Source: Capital Flow vs. Block Volume
Mkt-Viper Edge allows you to choose how volume is calculated in the **"Volume Analysis"** settings:
1. **Block Volume (Default):** Calculates based on raw share/contract count. Best for Crypto and Forex.
2. **Capital Flow:** Weights the volume by price (Volume \* Price). This visualizes the actual **Dollar Value** traded. Best for high-priced stocks (like AMZN or TSLA) or Indices, as it highlights where the "Big Money" actually changed hands, ignoring cheap retail volume.
#### 🔹 Sentiment Model (The Logic)
This setting determines how the engine classifies volume as "Bullish" or "Bearish."
* **Wick Pressure (Default & Recommended):**
* **Logic:** A proprietary algorithm that analyzes the intra-bar battle. It compares the Upper Wick (selling pressure) to the Lower Wick (buying pressure) relative to the body.
* **Why use it:** This is far more accurate than standard volume. It can detect "Hidden Buying" inside a Red candle (e.g., a Hammer candle at the bottom of a downtrend).
* **Polarity (C > O):**
* **Logic:** Simple calculation. If Close > Open, all volume is counted as Bullish. If Close \< Open, all volume is counted as Bearish.
* **Why use it:** Standard "Up/Down Volume" analysis. Useful if you prefer the classic method used by most stock scanners.
#### 🔹 Matrix Lookback (Time Horizon)
* **Setting:** Matrix Lookback (Default: 500).
* **Definition:** This controls the **Depth of Vision** for the Money Flow Matrix. It determines exactly how many past candles are included in the volume calculation.
* Default (500 bars): Analyzes the last \~500 candles. On a 5m chart, this covers roughly 2 days of price action.
#### 🔹 Matrix Row Density
* **Setting:** Matrix Row Density (10-100).
* **What it does:** Controls the vertical resolution of the profile.
* **Low Density (10-20):** Groups volume into broad blocks. Best for identifying general support/resistance zones on higher timeframes.
* **High Density (50-100):** Splits volume into fine slivers. Best for "Sniper" entries where you need to see the exact price tick where volume dried up.
#### 🔹 Visual Layout & Anchoring
* **Anchor Offset:** Adjusts how far the Matrix sits from the current price bar. Increase this value to push the profile to the far right, preventing it from obscuring your recent candlesticks.
* **Wing Width:** Controls how wide the volume bars extend.
* **Text Size:** Set to **"Auto"** by default, but can be forced to Tiny, Small, or Normal depending on your screen resolution (4K vs. Laptop).
#### 🔹 Point of Control (POC) Modes
* **Show POC Extension:**
* When enabled, it draws a semi-transparent Gold Box extending from the POC to the current price. This visualizes the "Magnet Zone" clearly across the chart.
* **Show POC Only (Hide Matrix):**
* **Minimalist Mode.** If you find the full Volume Matrix too distracting, enable this toggle. It will hide all the volume bars and wings, leaving **only** the critical POC level and Value Area lines visible. This gives you the data without the clutter.
### Data Source: Capital Flow vs. Block Volume
Mkt-Viper Edge allows you to choose how volume is calculated in the **"Volume Analysis"** settings:
1. **Block Volume (Default):** Calculates based on raw share/contract count. Best for Crypto and Forex.
2. **Capital Flow:** Weights the volume by price (Volume \* Price). This visualizes the actual **Dollar Value** traded. Best for high-priced stocks (like AMZN or TSLA) or Indices, as it highlights where the "Big Money" actually changed hands, ignoring cheap retail volume.