> ## Documentation Index
> Fetch the complete documentation index at: https://docs.mkt-viper.com/llms.txt
> Use this file to discover all available pages before exploring further.
# Institutional Order Blocks
> What are institutional order blocks?
Market moves are not random; they originate from specific price levels where institutions have accumulated massive positions. These footprints are known as **Order Blocks (OB)**.
The Mkt-Viper Edge engine scans historical price action to identify the exact candles that started a strong move. It highlights these zones as high-probability areas for **Supply (Resistance)** and **Demand (Support)**.
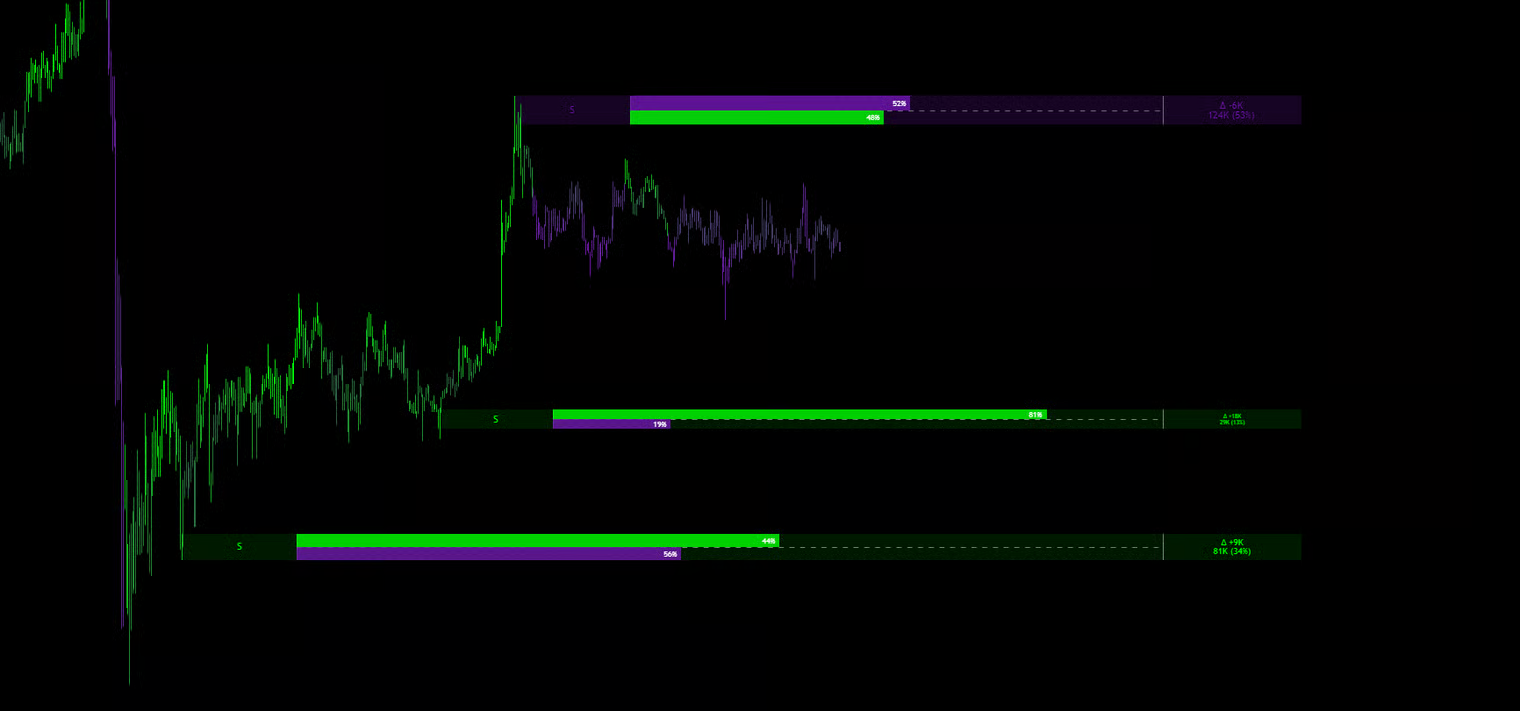 ### Strength Rank
Unlike other tools that just draw a colored rectangle, Viper Edge looks inside the Order Block to analyze the volume data. Every active zone features a data label providing critical insights:
### Strength Rank
Unlike other tools that just draw a colored rectangle, Viper Edge looks inside the Order Block to analyze the volume data. Every active zone features a data label providing critical insights:
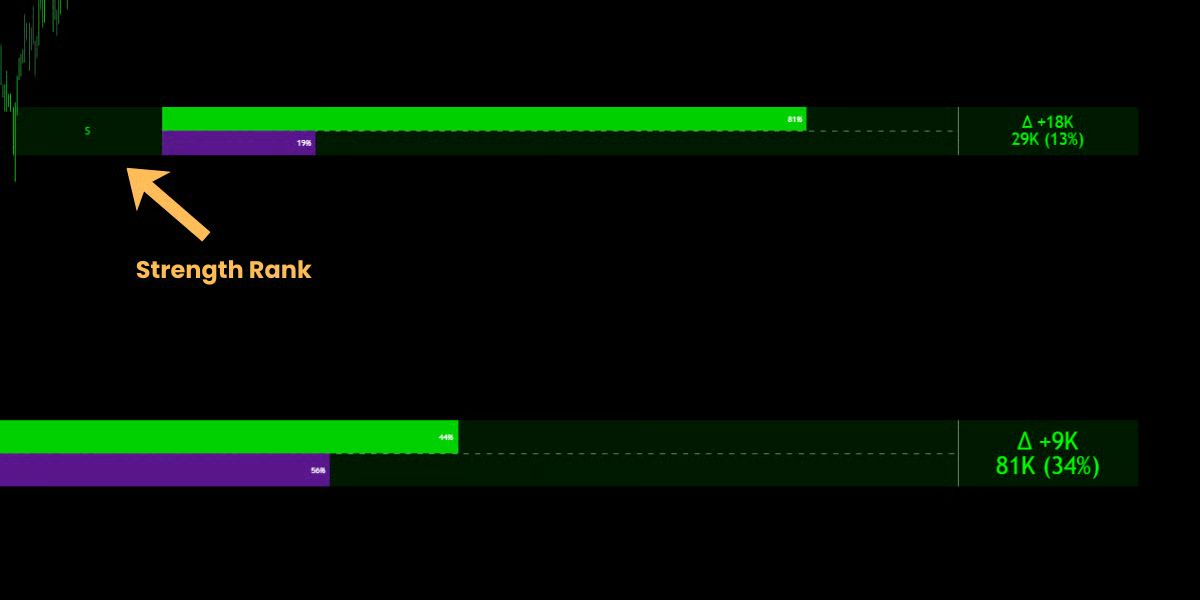 #### 🔹 Strength Rank
A letter badge appears on the left side of the block:
* **\[S] Strong:** The block was formed with **Above Average Volume**. These are high-probability zones.
* **\[W] Weak:** The block was formed with low volume. These zones are less reliable and may break easily.
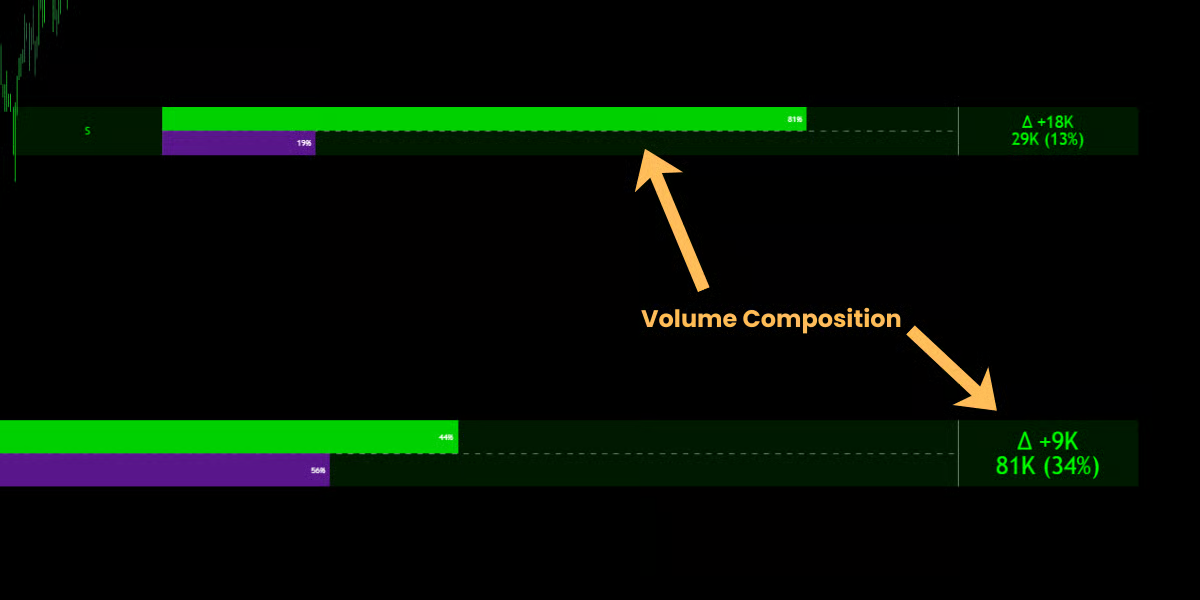
### Volume Composition
Mkt-Viper Edge provides an "X-Ray" view of every Order Block. Extending from the right side of every zone, you will see a **Data Tab** containing specific numbers.
This data tells you not just where the orders are, but how aggressive the institutional participation was during the creation of that zone.
#### 🔹 Strength Rank
A letter badge appears on the left side of the block:
* **\[S] Strong:** The block was formed with **Above Average Volume**. These are high-probability zones.
* **\[W] Weak:** The block was formed with low volume. These zones are less reliable and may break easily.
### Volume Composition
Mkt-Viper Edge provides an "X-Ray" view of every Order Block. Extending from the right side of every zone, you will see a **Data Tab** containing specific numbers.
This data tells you not just where the orders are, but how aggressive the institutional participation was during the creation of that zone.
 #### 🔹 1. Cumulative Volume (Total Fuel)
* **What it is:** The bottom number in the Data Tab (e.g., 81k).
* **Definition:** This is the total sum of all volume or contracts traded during the formation of this Order Block.
* **How to read it:** Think of this as the "Weight" or "Mass" of the wall.
* A zone with **5M** volume is concrete. It will take a lot of effort to break it.
* A zone with **50k** volume is drywall. Price might smash right through it.
#### 🔹 2. Delta Volume (Net Aggression)
* **What it is:** The top number with the Δ symbol (e.g., Δ +450K).
* **Definition:** Delta represents the **Net Difference** between Buying Volume and Selling Volume.
* Buy Volume - Sell Volume = Delta
* **How to read it:** This tells you who won the battle.
* **Positive Delta (+):** Buyers were the aggressors.
* **Negative Delta (-):** Sellers were the aggressors.
* Strategy: If you see a Bullish Order Block (Green) with a massive **Positive Delta**, it confirms that the move up was driven by aggressive market buying, not just a lack of sellers.
#### 🔹 3. The Composition Percentages (The Ratio)
* **What it is:** The two small percentages inside the colored bars (e.g., 82% / 18%).
* **Definition:** This breaks down the Total Volume into a ratio of Buying vs. Selling pressure.
* **How to read it:**
* **Top Number:** The dominant pressure (Buy % for Green Zones, Sell % for Red Zones).
* **Bottom Number:** The opposing pressure.
* **The "Golden Ratio":** Look for zones where the dominant side is **> 70%**.
* Example: A Bullish OB with **85% Buy** / **15% Sell**.
* Meaning: This was a one-sided domination. Institutions absorbed almost all liquidity. When price returns to this level, it is extremely likely to bounce because the sellers were already annihilated here.
### Visual Behavior
* **Bullish OB (Green):** A Demand Zone. Look for Long entries when price returns here.
* **Bearish OB (Purple/Red):** A Supply Zone. Look for Short entries when price returns here.
* **Mitigation (Greying Out):** Once price touches ("mitigates") a zone, the orders are considered filled.
* Default: The box is deleted from the chart to focus on fresh levels.
* Show Mitigated: If enabled in settings, the box turns **Grey** and fades into the background. This allows you to see historical reactions without distracting from live levels.
### Settings & Filters
You have full control over which blocks appear via the **"Order Blocks"** settings group.
#### 🔹 1. Cumulative Volume (Total Fuel)
* **What it is:** The bottom number in the Data Tab (e.g., 81k).
* **Definition:** This is the total sum of all volume or contracts traded during the formation of this Order Block.
* **How to read it:** Think of this as the "Weight" or "Mass" of the wall.
* A zone with **5M** volume is concrete. It will take a lot of effort to break it.
* A zone with **50k** volume is drywall. Price might smash right through it.
#### 🔹 2. Delta Volume (Net Aggression)
* **What it is:** The top number with the Δ symbol (e.g., Δ +450K).
* **Definition:** Delta represents the **Net Difference** between Buying Volume and Selling Volume.
* Buy Volume - Sell Volume = Delta
* **How to read it:** This tells you who won the battle.
* **Positive Delta (+):** Buyers were the aggressors.
* **Negative Delta (-):** Sellers were the aggressors.
* Strategy: If you see a Bullish Order Block (Green) with a massive **Positive Delta**, it confirms that the move up was driven by aggressive market buying, not just a lack of sellers.
#### 🔹 3. The Composition Percentages (The Ratio)
* **What it is:** The two small percentages inside the colored bars (e.g., 82% / 18%).
* **Definition:** This breaks down the Total Volume into a ratio of Buying vs. Selling pressure.
* **How to read it:**
* **Top Number:** The dominant pressure (Buy % for Green Zones, Sell % for Red Zones).
* **Bottom Number:** The opposing pressure.
* **The "Golden Ratio":** Look for zones where the dominant side is **> 70%**.
* Example: A Bullish OB with **85% Buy** / **15% Sell**.
* Meaning: This was a one-sided domination. Institutions absorbed almost all liquidity. When price returns to this level, it is extremely likely to bounce because the sellers were already annihilated here.
### Visual Behavior
* **Bullish OB (Green):** A Demand Zone. Look for Long entries when price returns here.
* **Bearish OB (Purple/Red):** A Supply Zone. Look for Short entries when price returns here.
* **Mitigation (Greying Out):** Once price touches ("mitigates") a zone, the orders are considered filled.
* Default: The box is deleted from the chart to focus on fresh levels.
* Show Mitigated: If enabled in settings, the box turns **Grey** and fades into the background. This allows you to see historical reactions without distracting from live levels.
### Settings & Filters
You have full control over which blocks appear via the **"Order Blocks"** settings group.
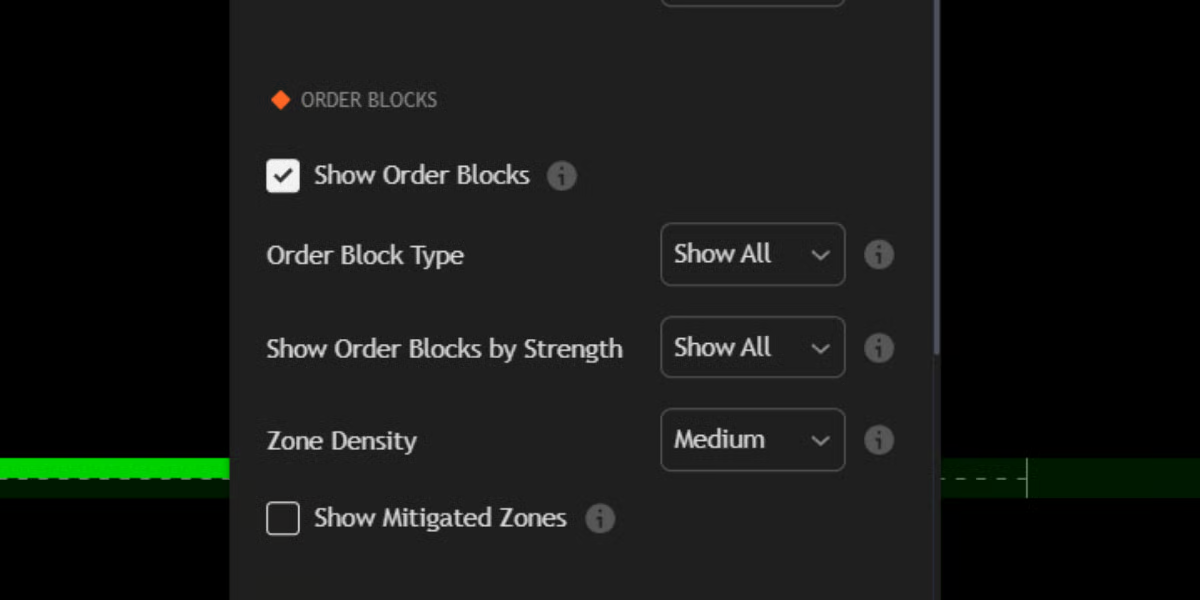 * **Zone Density:** Controls the history depth.
* Low: Shows the 3 most recent zones (Scalping).
* Medium: Shows the 5 most recent zones (Day Trading).
* High: Shows the 10 most recent zones (Swing Analysis).
* **Filter Type:** Choose to see **"Strong Only"** to filter out the noise and only trade the highest quality setups.
* **Volatility Clamp:** (Automatic Feature) If the candle that created the Order Block is massive (High Volatility), the engine automatically highlights only the **premium/discount** portion (the 50% edge) of the candle, rather than the whole range. This tightens your entry zone and improves Risk/Reward.
**Strategy: The "Tap & Go"**
Order Blocks are best used for **Limit Orders**.
1. **Identify:** Wait for a \[S] Strong Bullish Order Block to form.
2. **The Wait:** Be patient. Price often rallies away and then slowly drifts back to the zone.
3. **The Entry:** Set a Buy Limit order at the **Top Edge** of the Bullish Box.
4. **The Stop:** Place your Stop Loss just below the **Bottom Edge** of the box.
5. **Result:** This strategy catches the "Retest" as institutions defend their original entry price.
* **Zone Density:** Controls the history depth.
* Low: Shows the 3 most recent zones (Scalping).
* Medium: Shows the 5 most recent zones (Day Trading).
* High: Shows the 10 most recent zones (Swing Analysis).
* **Filter Type:** Choose to see **"Strong Only"** to filter out the noise and only trade the highest quality setups.
* **Volatility Clamp:** (Automatic Feature) If the candle that created the Order Block is massive (High Volatility), the engine automatically highlights only the **premium/discount** portion (the 50% edge) of the candle, rather than the whole range. This tightens your entry zone and improves Risk/Reward.
**Strategy: The "Tap & Go"**
Order Blocks are best used for **Limit Orders**.
1. **Identify:** Wait for a \[S] Strong Bullish Order Block to form.
2. **The Wait:** Be patient. Price often rallies away and then slowly drifts back to the zone.
3. **The Entry:** Set a Buy Limit order at the **Top Edge** of the Bullish Box.
4. **The Stop:** Place your Stop Loss just below the **Bottom Edge** of the box.
5. **Result:** This strategy catches the "Retest" as institutions defend their original entry price.