> ## Documentation Index
> Fetch the complete documentation index at: https://docs.mkt-viper.com/llms.txt
> Use this file to discover all available pages before exploring further.
# Viper Screener
> How does the Viper Screener work?
The Mkt-Viper Screener is the **Tactical Command Center** of the Viper ecosystem. It transforms your chart into an institutional dashboard, allowing you to monitor the health, trend, and structural bias of up to 20 assets simultaneously.
 Stop switching tabs to find setups. This tool runs the full **Viper V5 Calculation Kernel** in the background for every symbol on your watchlist. It aggregates Trend (Pro), Structure (Edge), and Momentum (Oscillator) data into a single, color-coded matrix, giving you an instant "God's Eye View" of the market.
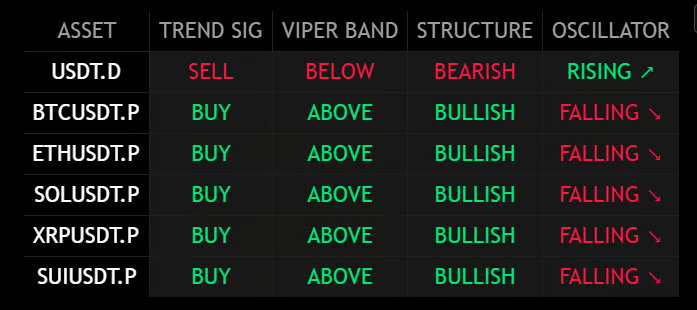
The dashboard organizes data into four critical columns, providing a complete technical profile for every asset:
**1. Trend Signal (Viper Pro Logic):** Displays the current status of the "Strike Line."
* **BUY (Green):** Price is currently signaling an uptrend on the Mkt-Viper Pro.
* **SELL (Red):** Price is currently signaling a downtrend on the Mkt-Viper Pro.
**2. Viper Band (Trend Health):** Indicates where price is relative to the volatility-adaptive Viper Band.
* **ABOVE:** Strong Bullish Trend.
* **BELOW:** Strong Bearish Trend.
* **INSIDE:** Ranging / Equilibrium (Neutral).
**3. Structure (Viper Edge Logic):** Monitors the swing pivots to determine Market Structure.
* **BULLISH:** Making Higher Highs/Lows.
* **BEARISH:** Making Lower Highs/Lows.
**4. Oscillator (Momentum Logic)**: Tracks the Kinetic Energy of the move.
* **RISING ↗:** Momentum is expanding upward.
* **FALLING ↘:** Momentum is contracting or expanding downward.
The screener includes the fully integrated **Viper Pro Auto-Tuner**.
Stop switching tabs to find setups. This tool runs the full **Viper V5 Calculation Kernel** in the background for every symbol on your watchlist. It aggregates Trend (Pro), Structure (Edge), and Momentum (Oscillator) data into a single, color-coded matrix, giving you an instant "God's Eye View" of the market.
The dashboard organizes data into four critical columns, providing a complete technical profile for every asset:
**1. Trend Signal (Viper Pro Logic):** Displays the current status of the "Strike Line."
* **BUY (Green):** Price is currently signaling an uptrend on the Mkt-Viper Pro.
* **SELL (Red):** Price is currently signaling a downtrend on the Mkt-Viper Pro.
**2. Viper Band (Trend Health):** Indicates where price is relative to the volatility-adaptive Viper Band.
* **ABOVE:** Strong Bullish Trend.
* **BELOW:** Strong Bearish Trend.
* **INSIDE:** Ranging / Equilibrium (Neutral).
**3. Structure (Viper Edge Logic):** Monitors the swing pivots to determine Market Structure.
* **BULLISH:** Making Higher Highs/Lows.
* **BEARISH:** Making Lower Highs/Lows.
**4. Oscillator (Momentum Logic)**: Tracks the Kinetic Energy of the move.
* **RISING ↗:** Momentum is expanding upward.
* **FALLING ↘:** Momentum is contracting or expanding downward.
The screener includes the fully integrated **Viper Pro Auto-Tuner**.
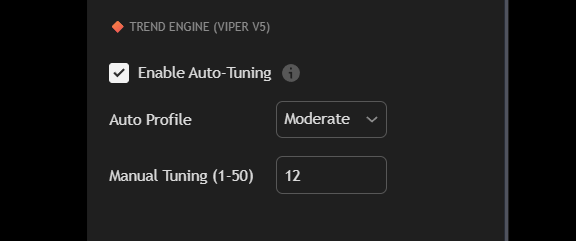 * **Auto-Tuning:** The dashboard automatically measures the "Path Efficiency" of the market to adjust sensitivity. You can toggle between **Fast, Moderate, and Slow** profiles to match your trading style (Scalping vs. Swing).
* **Global Timeframe:** Control the timeframe of the entire scan from a single dropdown menu. Scan the 4H trends while looking at a 15m chart.
Monitor up to **20 Custom Assets** of your choice.
* **Auto-Tuning:** The dashboard automatically measures the "Path Efficiency" of the market to adjust sensitivity. You can toggle between **Fast, Moderate, and Slow** profiles to match your trading style (Scalping vs. Swing).
* **Global Timeframe:** Control the timeframe of the entire scan from a single dropdown menu. Scan the 4H trends while looking at a 15m chart.
Monitor up to **20 Custom Assets** of your choice.
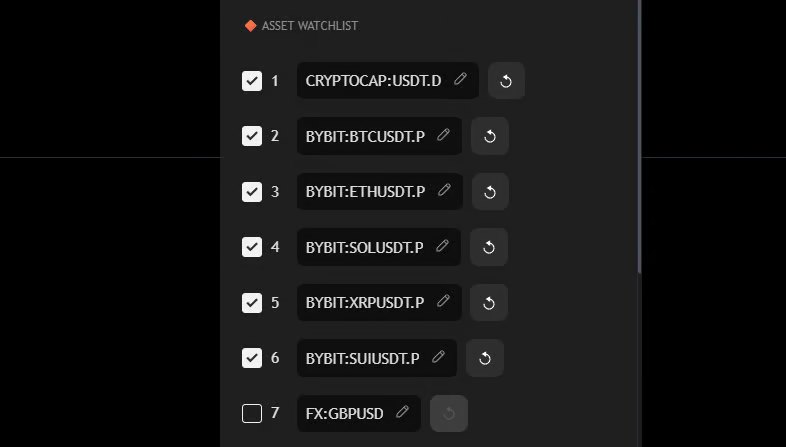 * The script allows you to input any ticker available on TradingView (Crypto, Forex, Indices, Stocks).
* Toggle specific slots On/Off to keep your dashboard clean.
* The script allows you to input any ticker available on TradingView (Crypto, Forex, Indices, Stocks).
* Toggle specific slots On/Off to keep your dashboard clean.